What is Six Sigma? Six Sigma Levels | Methodology
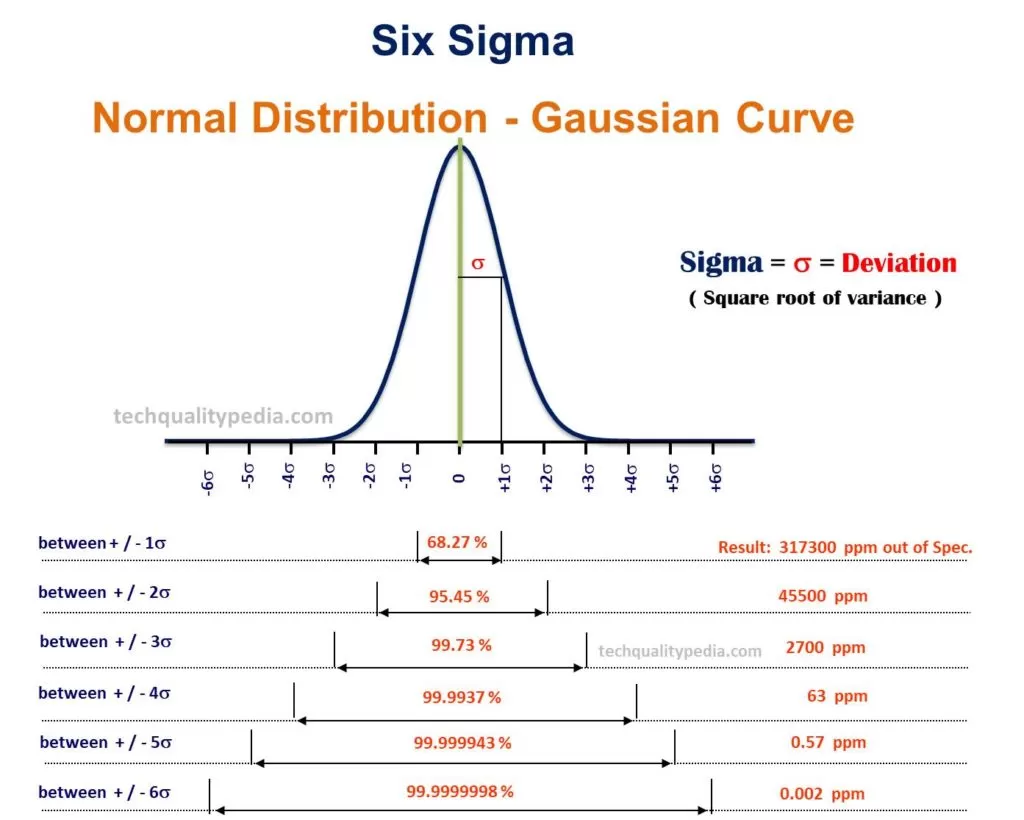
Six Sigmais a quality improvement programme with a prime goal to reduce the number of defects to as low as 3.4 parts per million(PPM) by process variation reduction. It uses the Normal Distribution to predict failure/defective rates.
WhenSix Sigma Methodologyis used, variance is reduced and process capability and performance are simultaneously increased.
A product is said to be of 6sigma (6σ) quality if there are no more than 3.4 defects per million opportunities(DPMO) at the part and process step level.
The six sigma uses two methodologies for completing projects or problem solving.
- DMAIC Methodology
- MADV Methodology
What is GD&T?
- Geometric Dimensioning and Tolerancing is an International language that uses symbols and standards.
- GD&T symbols are used in drawings to describe a part accurately.
- The GD&T language comprises of symbols, dimensions, tolerances, rules, and definitions for defining a geometry of part features.
GD&T Tolerance Symbols
GD&T Tolerance Symbolsare a set of fourteen Symbols used in the language of geometric tolerancing. The symbols are divided into 5 categories:
- Form
- Profile
- Orientation
- Runout
- Location
Cp and Cpk | Process Capability Analysis
The process capability indices(Cp and Cpk) are also called process capability index and are used forprocess capability analysis.
Process capabilityanalysis is carried out to measure the ability of a process to meet the specifications.
AHistogramandControl Chartsare the basic7 QC Toolsthat are used inprocess capabilityanalysis.
Six Sigma Methodologyis used to improveprocess capabilitybyprocess variationreduction.
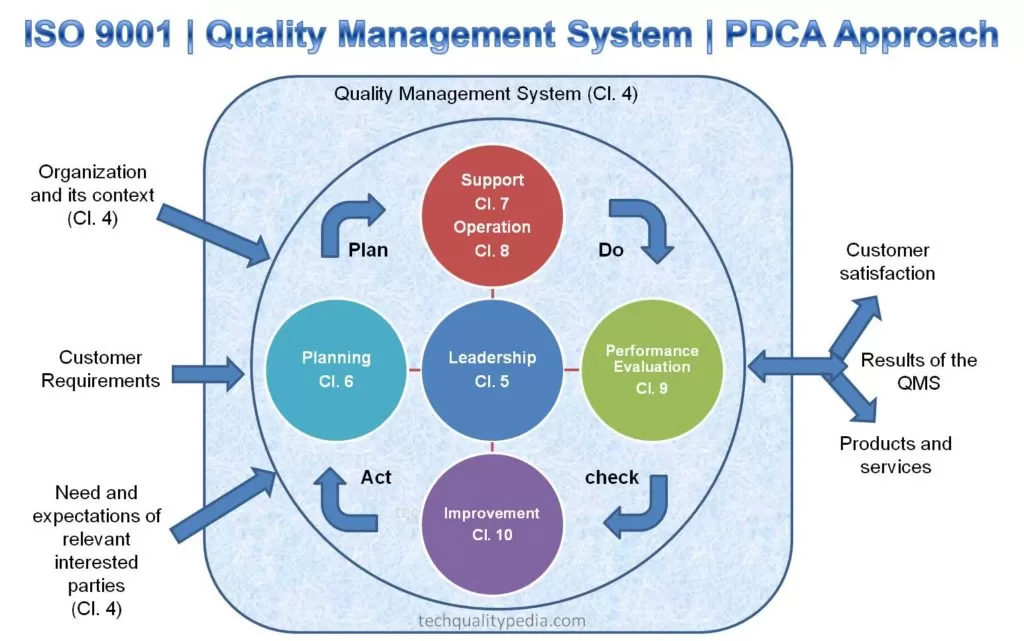
What is the ISO 9001? ISO 9001 2015 | Requirements | Principles

ISO 9001standard defines the QMS (Quality Management System) requirements, aims to produce quality products and services, and ultimately to meets customer needs and expectations.
The revisedISO 9001:2015 standard is based on the high-level structure and integrates with other management systems such asIATF 16949, ISO 14001 (Environmental Management Stanadard), andISO 45001(Occupational Health and Safety Management Stanadard) standards.
TPM Pillars | Total Productive Maintenance
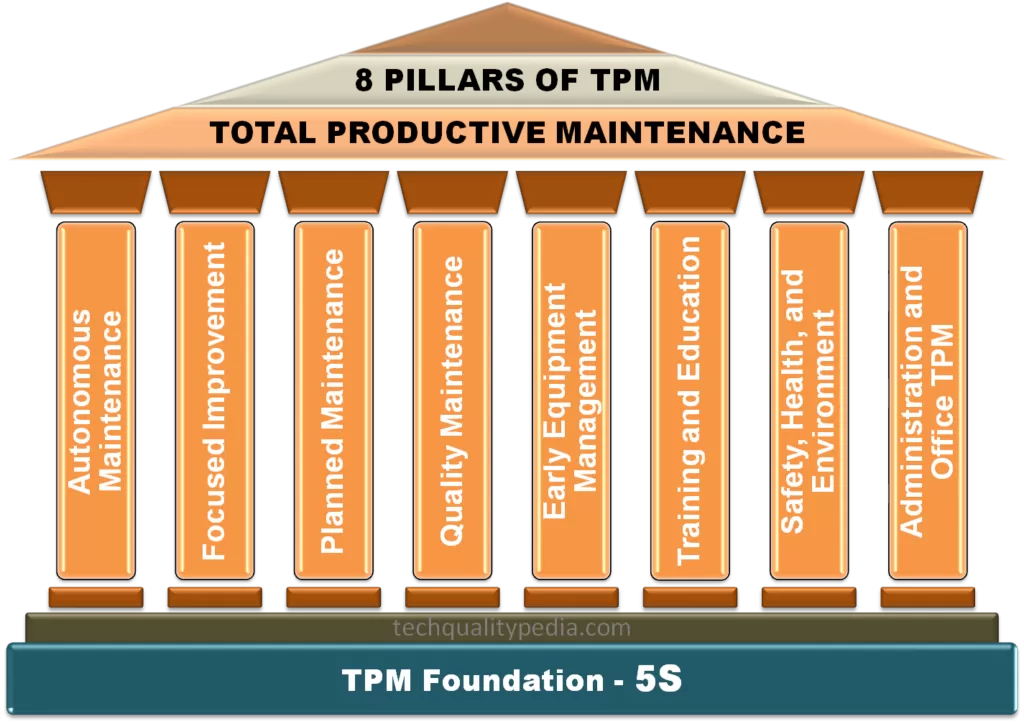
TPMstands forTotal Productive Maintenance.TPM was developed around the 1960s and it consists of eight supporting activities or 8 pillars.
The5S methodologyis the foundation stone of theTPMimplementation program. TPM strives for effective and efficient production. That is;
- No or Fewer Breakdowns
- No Small Stops or Slow Running
- No Accidents-provide a safer workplace
- No Defects
Accuracy and Precision | What is precision in measurement?
Accuracy and Precisionare the two important term that often comes into picture during the measurement, testing, and calibration process. The effectiveness of the decisions is based on the measurement data’s accuracy and precision.
Equipment with highaccuracy and highprecisionwill always lead to better decisions, improvequalityof measurement data, low variations, and fewer errors.
7 QC Tools | 7 Quality Tools | Process Improvement Tools
7 QC Tools are also known as Seven Basic Quality Tools. These graphical and statistical tools are used to analyze and solve work-related problems effectively. 7 QC tools are widely used inSPCand Problem-Solving Techniques such as8Dand Six Sigma- DMAIC.
The list of Seven Basic Quality Tools of “Problem Solving” are:
- Check Sheet
- Fishbone Diagram
- Histogram
- Pareto Chart
- Control Chart
- Scatter Diagram
- Stratification Diagram(Some lists replace stratification withProcess Flowchart)
8D Approach | Eight Disciplines of “Problem Solving”
What is 8D? 8D Methodology | 8D Report
“8D” Methodology consists of Eight disciplines of “Problem Solving.“ The basic 7 QC Tools are commonly applied in the 8D methodology. The 8D Problem Solving technique is widely used byQualityengineers working in manufacturing industries.
Apart from8D, there are variousProblem-Solvingtools or methodologies like PDCA Deming Cycle,Quality Circle, andSix Sigma – DMAIC, etc. that are commonly applied in a variety of organizations to identify and solve work-relatedqualityproblems.
Lean Manufacturing | Lean Principles | Lean Manufacturing Tools
Lean Manufacturingis a standardized approach for the identification and elimination of waste (non-value-added process/activities) for achieving perfection.
A systematic approach for maximization of value and elimination of waste.
“A systematic/standardized approach that reduces the time-frame between the customer’s order and delivery of product through waste elimination.
There are variousLean Manufacturing Toolsor ways to be Lean:
- Lean 5S
- 7 waste of Lean Manufacturing
- Value Stream Mapping-VSM
- KAIZEN
- POKA-YOKE
- Total Quality Management-TQM
- Total Preventive Maintenance-TPM
- Six Sigma-DMAIC
- Single Minute Exchange of Die-SMED
- Just In Time-JIT
- Continuous Improvement/PDCA
- Cellular Manufacturing
- And many more Lean Manufacturing Tools…
7 Types of Waste | What is Muda, Mura, Muri | 3M Waste
7 Waste of lean manufacturing | Muda | How to reduce waste?
Muda stands for eliminating waste or non-value-added activities from the manufacturing process. 7 wastes of Lean Manufacturing come underMuda.
Explore 3M Waste of Lean Manufacturing – Muda, Mura, and Mur
- MUDAmeans Waste
- MURAmeans Inconsistency/Unevenness/Imbalance
- MURImeans Strain/Overburden/Fatigue
What is SPC? Statistical Process Control | SPC in Quality
SPC– Statistical Process Control is used to measure and control the Process Variability,Process Capability, and controlling quality during the production process.
InStatistical Process Control, product or process measurements data are obtained in real-time during the manufacturing process and then data is plotted on aControl Chartwith predetermined control limits. From the control chart, process data is analyzed to understand the process variability present in the production process for taking necessary corrective measures.
TQM | TOTAL QUALITY MANAGEMENT | TQM Meaning
TQM-Total Quality Management term focuses on customer satisfaction through Total Employee Involvement-TEI and Continual Improvement in Process and Services. Total Quality Managementrefers to Quality Management that involves all Department’s participation and cooperation throughout the company.
Explore the TQM System, Principles, Implementation procedures, and benefits.
What is APQP? Advanced Product Quality Planning | APQP Phases
APQP – Advanced Product Quality Planning is a structured approach used to design and develop the product and process to meet customer needs and expectations.
APQP is one of the most important tools among the fivequality core tools of IATF 16949.
Quality Assurance and Quality Control | Difference and Meaning
Quality AssuranceandQuality Controlactivities are part of a Quality System or Quality Management System. QA includes QC.
QAcontains all those planned and systematic actions necessary to provide adequate confidence that a product or service will satisfy/fulfill given requirements forQuality.
Quality Controlis a set of activities for ensuring quality in theProducts.
MTTR and MTBF | Meaning and Formula with examples
Mean Time To Repair (MTTR) and Mean Time Between Failure (MTBF) are the two most important key performance indicators or metrics that are used in the Maintenance process or reliability engineering to measure the performance of machines and equipment.MTTR and MTBFKPIs tools are widely used by theLean Manufacturingindustries andIATF 16949-certified Automotive industries to enhanceOverall Equipment Effectiveness.
You May also like:


