Special Causes of Variation are also known as Assignable Causes (un natural) of variation.
If Special cause of variations are present in a process, then the voice of the process is neither stable nor predictable and is said to be out of statistical control.
SPC technique uses Control Charts to monitor and control the Special Cause of variations present in the manufacturing process.
Control Chart is considered as one of the Seven Basic Quality Tools used for product and process improvement.

Table of Contents
Special Causes (Assignable causes)
- Special cause of variation are not always acting on the process.
- Process is not under Statistical control.
- Process output is unpredictable.
- Process is not stable over time.
- Erratic fluctuations and Shift occurred in process.
Type of Special Causes of Variation
- Extreme Variations
- Erratic Fluctuations
- Shifts
- Indication of Trend
Extreme Variations : Extreme variation is recognized by the points falling outside the Upper and Lower control limits.

Causes of Extreme Variations:
- Error in measurements and calculations.
- Wrong setting of machine, tools etc.
- Samples chosen at the start or at the end of an operation.
Erratic Fluctuations : Erratic fluctuation is characterized by ups and downs. This may be due to single cause or a group of causes affecting the process.

Causes of Erratic Fluctuations:
- Frequent adjustment of machine.
- Change in Man, machine , method and material etc.
- Processing of different types of material.
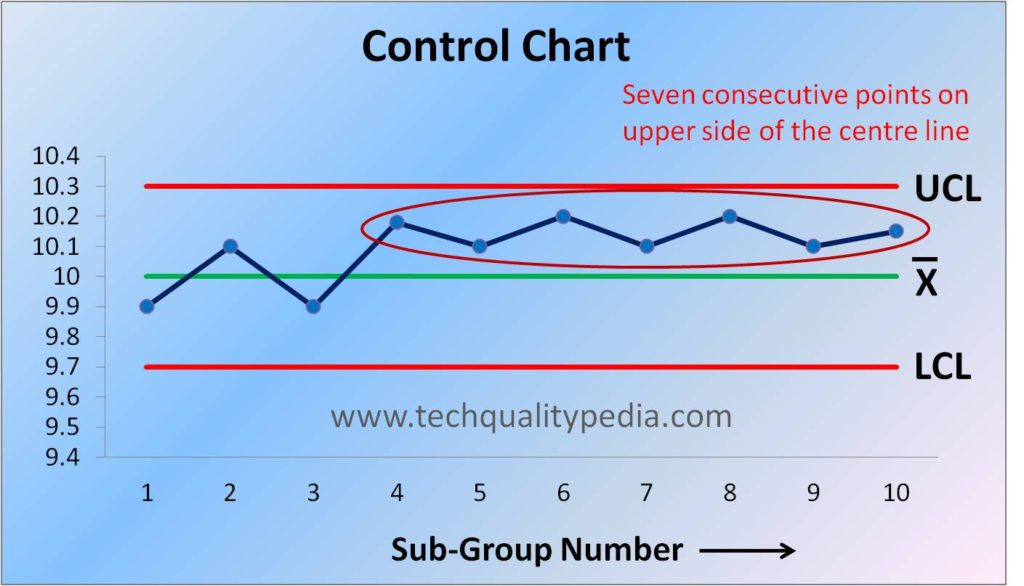
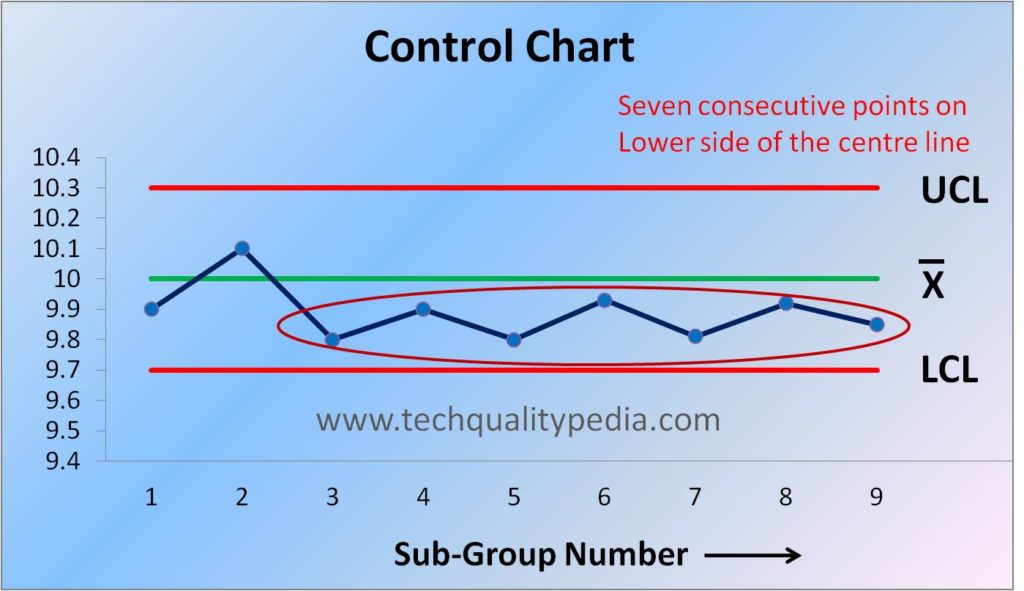
Shift : When a series of consecutive points fall above or below the centre line on the control chart then it is assumed that shift in the process has taken place. It is generally assumed that when 7 consecutive points lie above or below the centre line, the shift is occurred.
Causes of Shift:
- Change in Machine setting.
- Change in Material.
- Loose fixture etc.
- Change in Operator, Inspector and Inspection equipment.
- Unskilled or New operator or carelessness of the operator.
Indication of Trend : If the consecutive points on control chart tend to move steadily either towards Upper Control Limits (UCL) or Lower Control Limit (LCL), then it can be assumed that process is indicating a ‘Trend’ i.e. change is taking place slowly.


Causes of Trend:
- Tool wear
- Wear of thread on clamping device
- Clogging of fixtures and holes
- Effect of temperature and humidity.