SPC– Statistical Process Control is used to measure, record, analyze and control the Process Variability for quality improvement.
This technique is used to measure Process Capability and control quality during the production process.
SPC utilizes statistical thinking to control the process and to achieve continuous process improvement.
The SPC technique is widely applied in the Automotive, Engineering, and Manufacturing industries to monitor and control the manufacturing process by eliminating Process Variations.
In Statistical Process Control, product or process measurements data are obtained in real-time during the manufacturing process and then data is plotted on a Control Chart with predetermined control limits.
From the control chart, process data is analyzed to understand the process variability present in the production process for taking necessary actions.
Statistical Process Control is one of the important core tools of the IATF 16949 standard and is often used in the following statistical, quality, and productivity improvement tools/techniques.
- Total Quality Management-TQM
- Statistical Quality Control – SQC
- Lean Manufacturing
- Six Sigma
- 8D Problem-solving methodology
- 7 QC Tools for Process Improvement

Table of Contents
SPC Definitions
Statistical Process Control is a process of finding and measuring variability in the manufacturing process.
“A Statistical and graphical tool of quality assurance to measure process variations present in the production process.”
SPC Principles
- No two things are alike.
- The product we produce changes continuously.
- Variation is the law of nature and exists in all processes.
- Variation in a product and process can be always measured.
SPC Objectives
- Collecting the data and drawing meaningful results.
- Finding out the root cause of the problem.
- Understanding and reducing process variations.
- Predicting future tendencies.
- Preventing defects to improve product and process quality.
- Continuous process improvement.
- Improve Customer satisfaction.
SPC Tools
The important popular basic tools are :
- Control Charts
- Run Chart
- Histogram or Frequency Distribution Diagram
- Process Capability Analysis tools
SPC Strategy
The first strategy is to bring the process under control by removing special causes present in the manufacturing process.
The second strategy is to improve process capability by reducing common causes or chance causes present in the manufacturing process.
Steps for creating a Control Chart
- Select quality characteristics that need to be controlled.
- Decide the subgroup size i.e. number of units to be taken in a sample.
- Decide the subgroup frequency.
- Collect data on the data collection check sheet.
- Fill up the control chart data sheet.
- Calculate the X-bar and Range R for each subgroup.
- Calculate the grand average X-bar and average range R-bar
- Calculate Trial Control Limits.
- Process Capability Study.
- Actions for Improvement.
Control Charts types
SPC Control Charts are classified into two main categories:
- Attribute type Control Charts
- Variable-type Control Charts
Process capability
A process capability study is carried out to measure the ability of the process to meet the specified tolerance.
Process Capability = +/- 3 Sigma = Total spread of 6 Sigma
Process Variations
There are two types of process variations:
A common cause of variation. Also called Chance cause (natural) of variation.
Special Cause of Variation also called an Assignable cause (unnatural) of variation.
Interpretation of Control Chart
Extreme Variations: Extreme variation is recognized by the points falling outside the Upper and Lower control limits.

Causes of Extreme Variations:
- Error in measurements and calculations.
- Wrong setting of the machine, tools, etc.
- Samples were chosen at the start or the end of an operation.
- miscalculated or misplotted data points.
Shift: When a series of consecutive points fall above or below the center line on the control chart then it is assumed that a shift in the process has taken place. It is generally assumed that when 7 consecutive points lie above or below the center line, the shift has occurred.
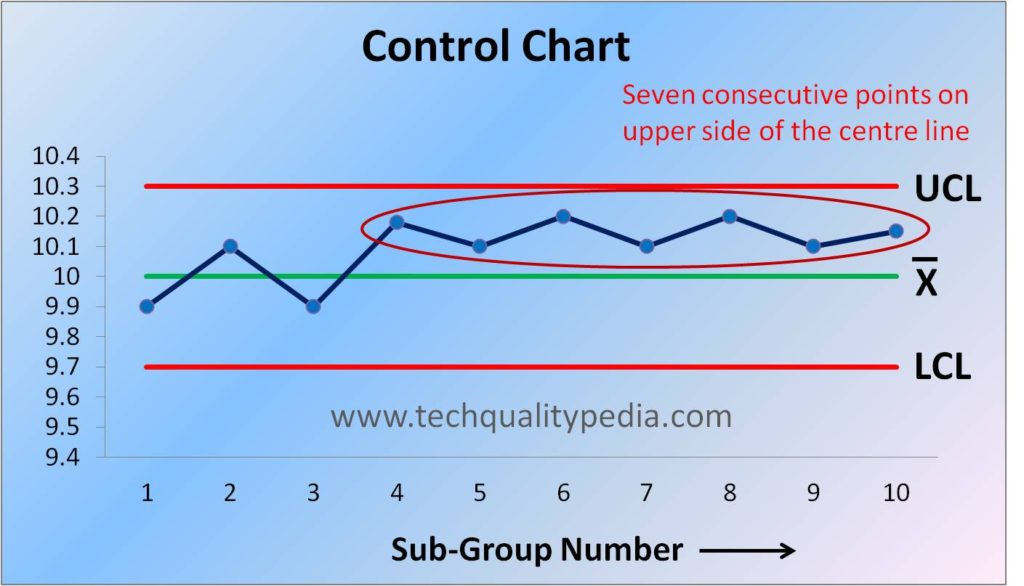
Seven consecutive points on the Upper side of the centre-line

Seven consecutive points on the Lower side of the centre-line
Causes of Shift:
- Change in Machine setting.
- Change in Material.
- Loose fixture etc.
- Change in Operator, Inspector, and Inspection equipment.
- Unskilled or New operator or carelessness of the operator.
Indication of Trend: If the consecutive points on the control chart tend to move steadily either towards Upper Control Limits (UCL) or Lower Control Limit (LCL), then it can be assumed that the process is indicating a ‘Trend’ i.e. change is taking place slowly.

Seven consecutive points having upward trend

Seven consecutive points having a downward trend
Causes of Trend:
- Tool wear
- Wear of thread on the clamping device
- Clogging of fixtures and holes
- Effect of temperature and humidity.
Erratic Fluctuations: Erratic fluctuation is characterized by ups and downs. This may be due to a single cause or a group of causes affecting the process. The cause of erratic fluctuations is rather difficult to identify. It may be due to various causes acting at different times in the manufacturing process.

Causes of Erratic Fluctuations:
- Frequent adjustment of the machine.
- Change in Man, machine, method, and material, etc.
- Processing of different types of material.
Process Capability Indices: Cp and Cpk
Process capability – Cp: This is defined as the tolerance width divided by the total spread of the process. Cp indicates the spread of variation present in a process.
Process Capability Index – Cpk: This capability index accounts for the centering of the process and is defined as the minimum of Cpk upper and Cpk lower.
Cpk indicates the shifting of the process from the target value or mean value.