Candlestick patterns bullish, bearish, and neutral are the most important and popular in the technical analysis of the stock market or share market. It gives an idea about the stock market price direction i.e. uptrend (bullish) or downtrend (bearish) of the stock market price.
Candlestick chart or patterns helps to make the right decisions for buying and selling stocks or shares. Traders and Investors can create wealth from the stock market or securities market by mastering the candlestick patterns, technical analysis tools, and proper risk management approach.
Table of Contents
CANDLESTICK BAR | CANDLESTICK COMPONENTS
A candlestick bar is a way of displaying information about a market price movement.
A candlestick bar has five components – open, close, high, and low prices for a specific period, and a body that shows the open-to-close price range. Let’s examine a picture of a daily candlestick bar:
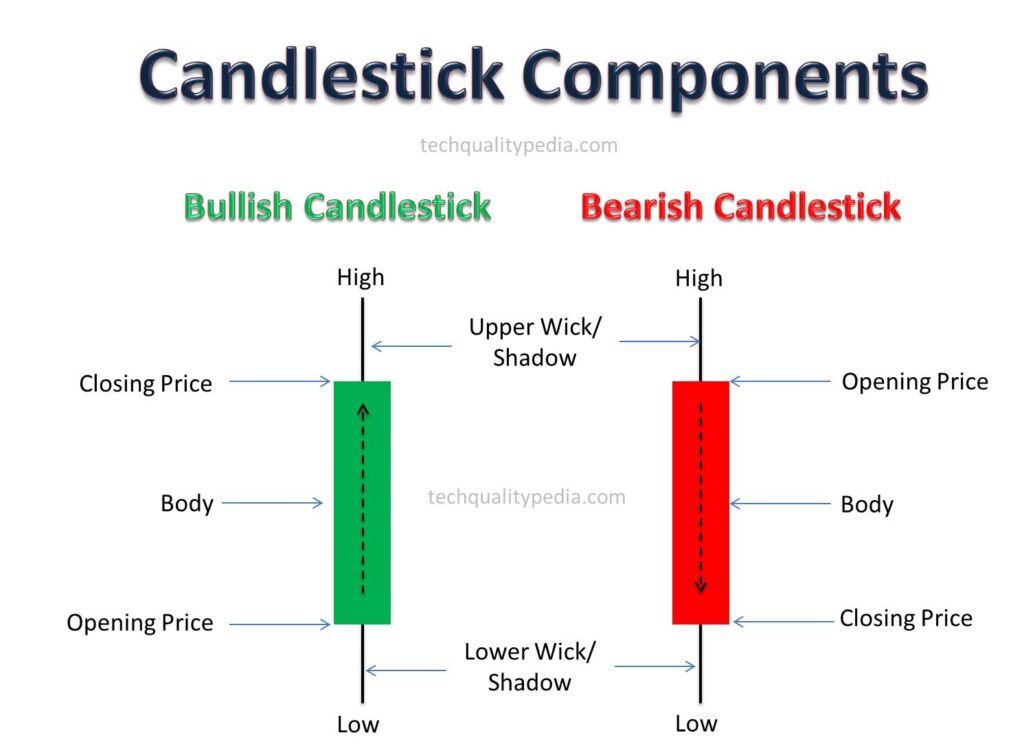
- Open Price: this is the first price at which the stock trades in one specific period.
- Close Price: this is the last price at which the stock trades in one specific period.
- High price: this is the highest price of the stock reached during the specific period.
- Low price: this is the lowest price of the stock reached during the specific period.
- Body: shows the open-to-close price range. The body color represents the direction of market movement i.e. indicates bullish or bearish price movement. A green body shows a price increase, while a red body shows a price decrease. A Green body is formed when the opening price is lower than the closing price, and a Red body is formed when the opening price is greater than the closing price.
CANDLESTICK PATTERNS | TYPES
Candlestick chart patterns are categorized into three ways:
- Bullish Patterns: Such as the Hammer, Dragonfly Doji, Bullish Engulfing, Morning Star, and Bullish Spinning Top.
- Bearish Patterns: Such as the Hanging Man, Shooting Star, Bearish Engulfing, Gravestone Doji, and Evening Star.
- Neutral Patterns: Such as the Doji, which can indicate indecision (can be bullish or bearish).
The most commonly used candlestick patterns categorized into bullish, bearish, and neutral patterns are briefly explained below with the image:
CANDLESTICK PATTERNS BULLISH
Bullish patterns may usually form after a market downtrend and indicate a probability of a bullish reversal trend i.e. upward price movement. Bullish candlestick patterns suggest that buyers are in control and move market prices upward direction.
The candlestick patterns bullish include:
Single Candlestick Pattern
- Hammer
- Inverted Hammer
- Dragonfly Doji
- Bullish Marubozu
Double Candlestick Pattern
- Bullish Engulfing
- Bullish Harami
Tripple Candlestick Pattern
- Morning Star
Candlestick Patterns Hammer
There are two types of Hammers patterns formed:
- Hammer Candlestick Pattern
- Inverted Hammer Candlestick Pattern
Hammer Candlestick Patterns
Image Description: A single candlestick with a small body at the top having a long lower wick(shadow) at least twice the body size and no or very small upper wick(shadow). The body color of a hammer candlestick can be either green or red.
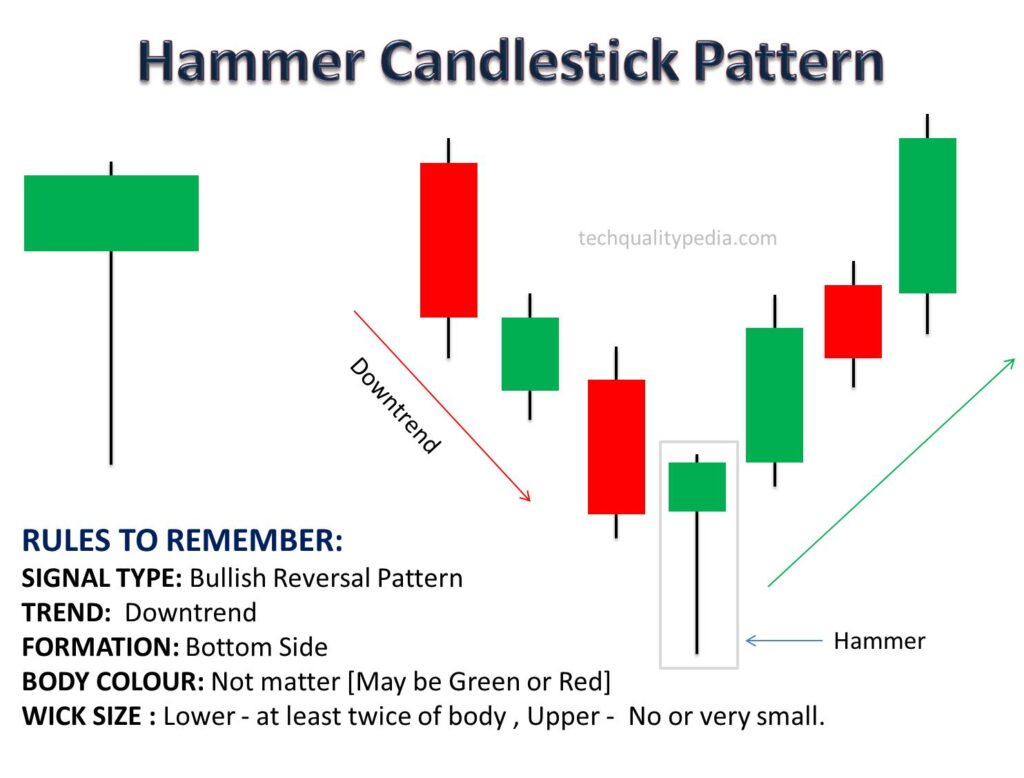 Explanation: The Hammer pattern appears after a downtrend and formed at the bottom side, indicating a bullish reversal pattern. The long lower wick suggests that sellers pushed prices downward but buyers managed to drive them upward, showing more buyer’s control/strength.
Inverted Hammer Candlestick Patterns
Image Description: A single candlestick with a small body at the bottom having a long Upper wick(shadow) at least twice the body size and no or very small Lower wick(shadow). The body color of a hammer candlestick can be either green or red.
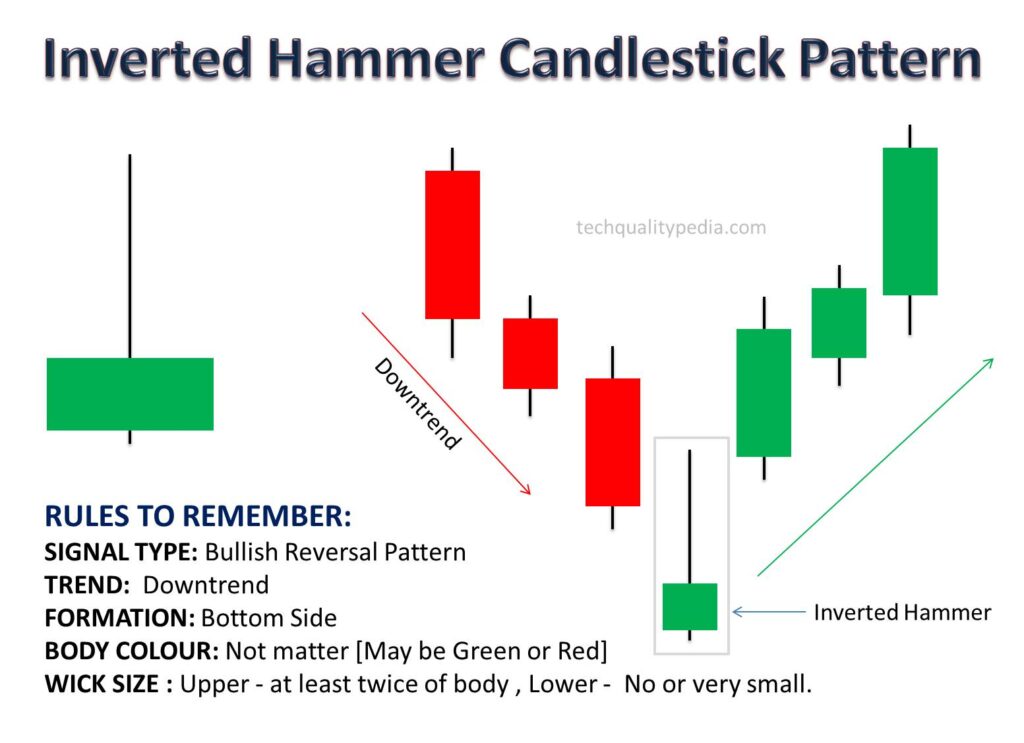 Explanation: The Inverted Hammer pattern appears after a downtrend and indicates a bullish reversal pattern. The long upper wick indicates that buyers are in control and push the price upward during the session, but sellers managed to move the price downward near the opening level. However, a long upper wick suggests buyers may take control soon and lead to bullish momentum.
Dragonfly Doji Candlestick Patterns
Image Description: The Dragonfly Doji candle patterns have very small or no upper wick and a long lower wick. The open, close, and high prices are nearly the same or very close and appear at the top of the candle.
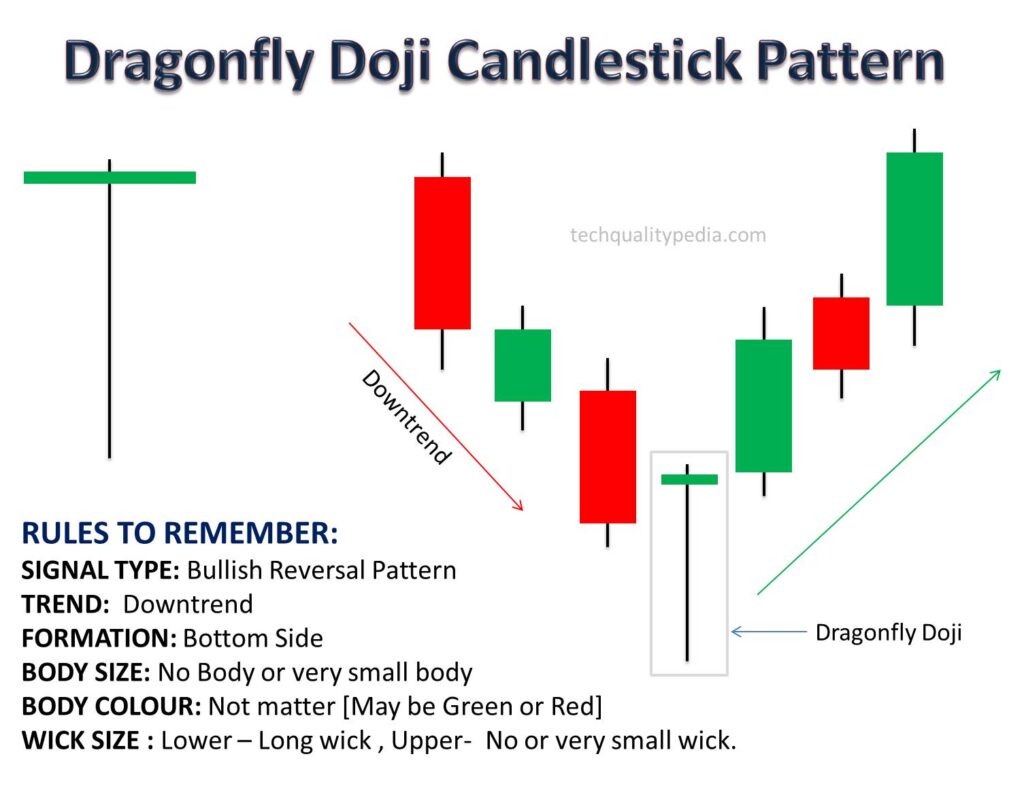
Explanation: The Dragonfly Doji appears after a downtrend and signals a bullish reversal. Initially, sellers pushed the price downward, but buyers managed to push back the price near the opening price level. This shows that the sellers were strong initially but at the end of the session, buyers became stronger and lifted the price.
Candlestick Patterns Marubozu
The Marubozu is a Japanese term that means “bald head” or “shaved head”. A Marubozu pattern is formed with a long body with no wick or shadows. It can either be a green candlestick body (Bullish) or a red candlestick body (Bearish)
There are two types of Marubozu candlestick patterns formed:
- Bullish Marubozu Candlestick Pattern
- Bearish Marubozu Candlestick Pattern
Bullish Marubozu Candlestick Patterns
Image Description: A Bullish Marubozu Candlestick pattern is formed with a long green body and no upper or lower wicks.
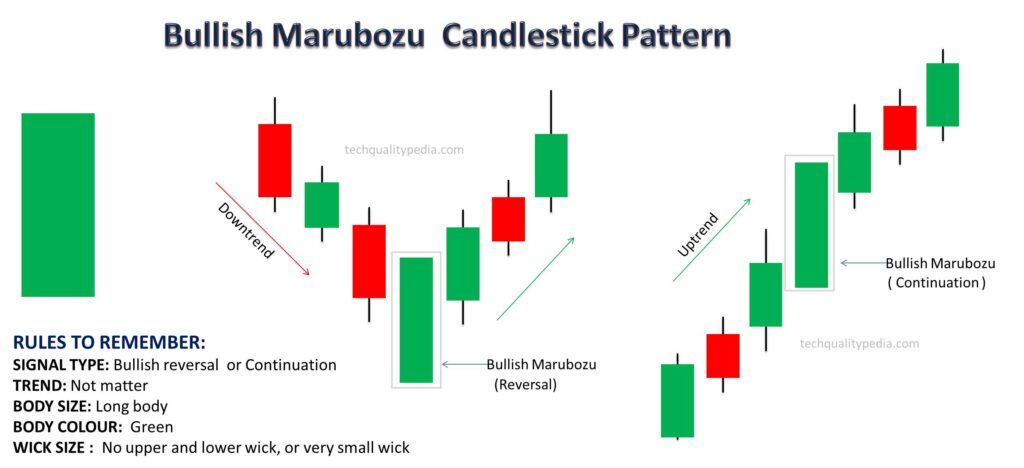 Explanation: A Bullish Marubozu indicates strong buying pressure from start to finish. The buyers were in control and managed to move the price upward during the entire session without any resistance from sellers.
Bullish Reversal or Continuation: It usually appears after a downtrend and signals the start of a bullish reversal. If it appears during an uptrend, it may signal the continuation of the bullish momentum.
Candlestick Patterns Engulfing
There are two types of Engulfing Candlestick formed:
- Bullish Engulfing Candlestick
- Bearish Engulfing Candlestick
Bullish Engulfing Candlestick
Image Description: The image is formed with Two candlesticks. The first is a small red candle, and the second is a larger green candle that fully engulfs the red candle.
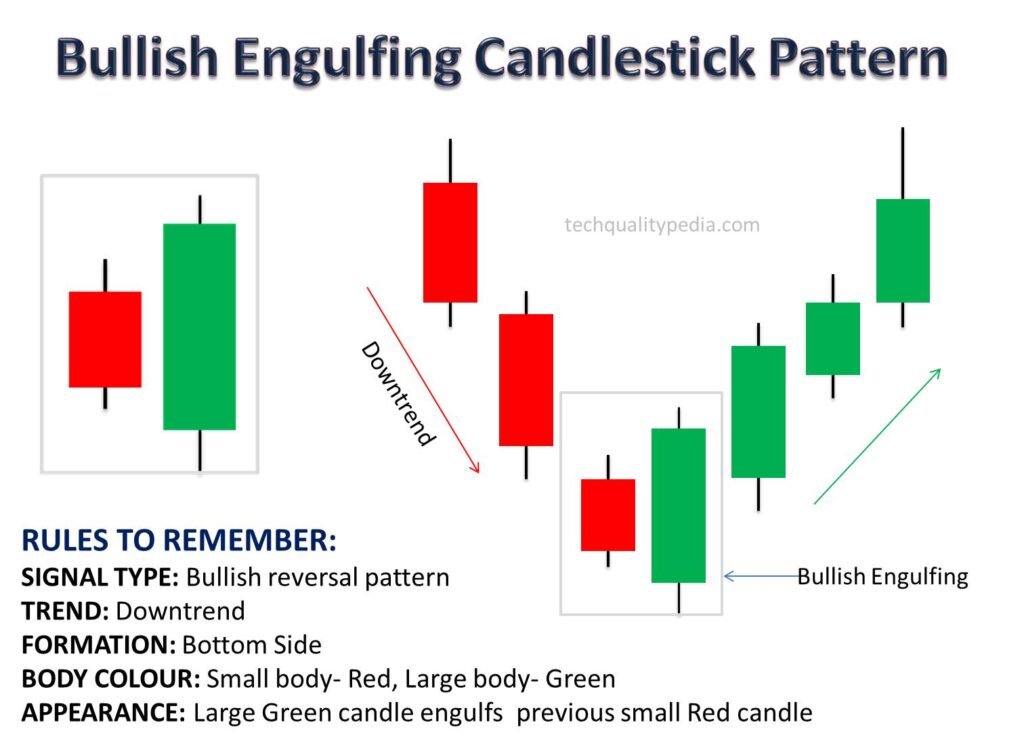
Explanation: This pattern forms when a larger bullish candle (green candlestick) engulfs or covers a previous small bearish candle (red candlestick) entirely. Indicating strong buyer’s control and a bullish reversal trend.
Bullish Harami Candlestick Patterns
Image Description: The Bullish Harami form with two candles. The first is a long red-body candle, and the second is a smaller green-body candle, which is entirely contained within the long red-body candle.
Explanation: The Bullish Harami candlestick appears after a downtrend and indicates a bullish reversal. The large red body candle shows strong selling pressure, but the smaller green candle inside the long red candle indicates that sellers are losing control, and buyers are gaining strength which could lead to a price upward.
Candlestick Patterns Morning Star
Image Description: Morning star candlestick patterns form with three candlesticks. The first one is a long candle with a red color body, followed by a small candle (it can be a green or red color body), and the third one is a long candle with a green body.
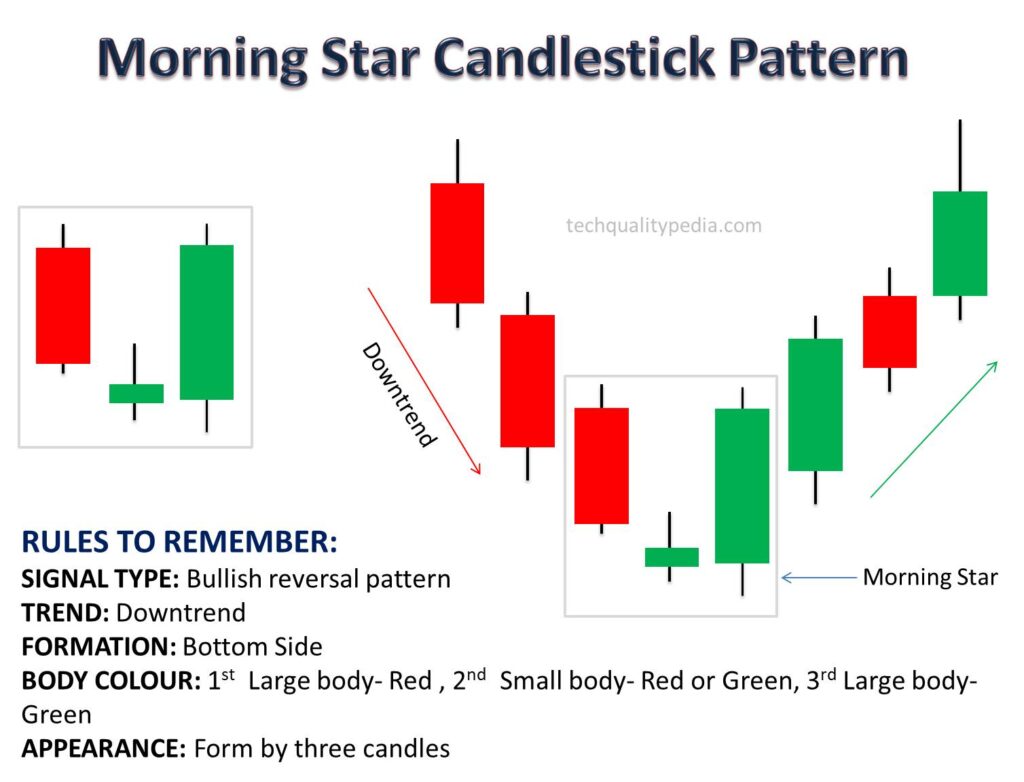
Explanation: Candlestick patterns morning star form a bullish reversal pattern after a downtrend. The small middle candle indicates indecision, and the third candle confirms the strong bullish reversal.
CANDLESTICK PATTERNS BEARISH
Bearish patterns may always form after an uptrend and indicate a probability of a bearish reversal trend i.e. downward price movement. It suggests that sellers are in control, and move market prices downward direction.
The Candlestick Patterns Bearish include:
Single Candlestick Pattern
- Shooting Star
- Hanging Man
- Gravestone Doji
- Bearish Marubozu
Double Candlestick Pattern
- Bearish Engulfing
- Bearish Harami
Tripple Candlestick Pattern
- Evening Star
Candlestick Patterns Shooting Star
Image Description: A single candlestick with a small body at the bottom. The long upper wick is at least twice the body size, and very small or no wick at the bottom. It is similar to an Inverted hammer but appears after an uptrend.
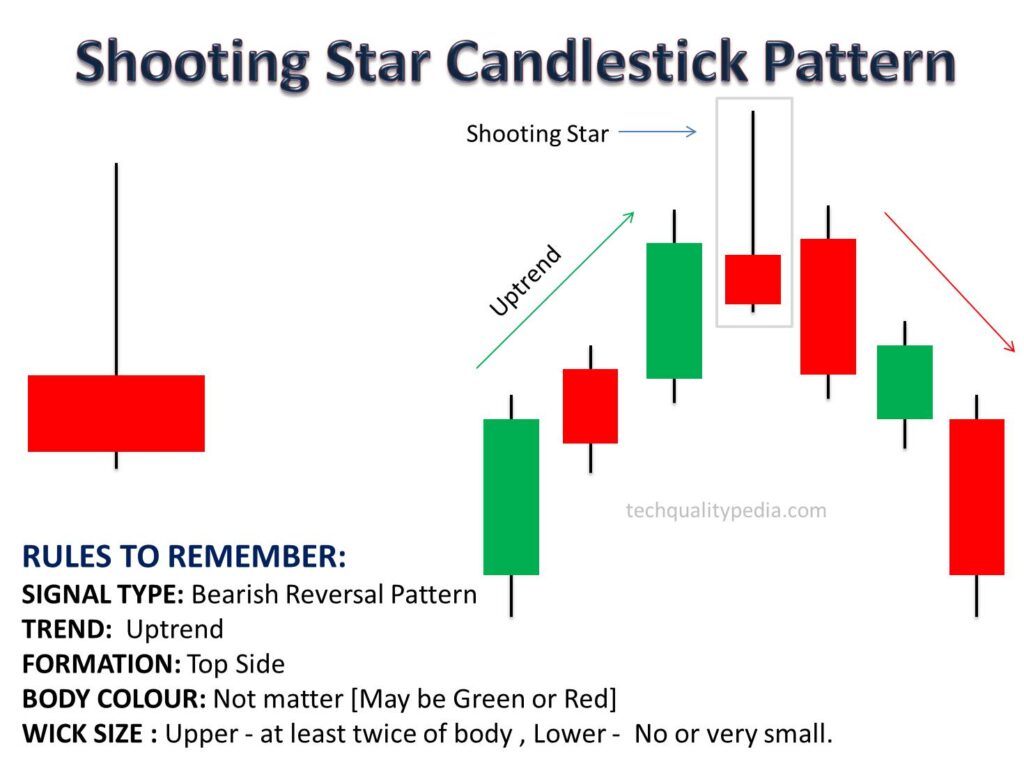
Explanation: It forms after an uptrend. The long upper wick shows buyers pushed prices upward, but sellers managed to move prices downward, indicating sellers are in control and a probability of bearish trend reversal.
Candlestick Patterns Hanging Man
Image Description: A Hanging Man candlestick is formed with a small body near the upper part of the candlestick. There is a very small or no upper shadow or wick and a long lower wick (at least twice the body size).
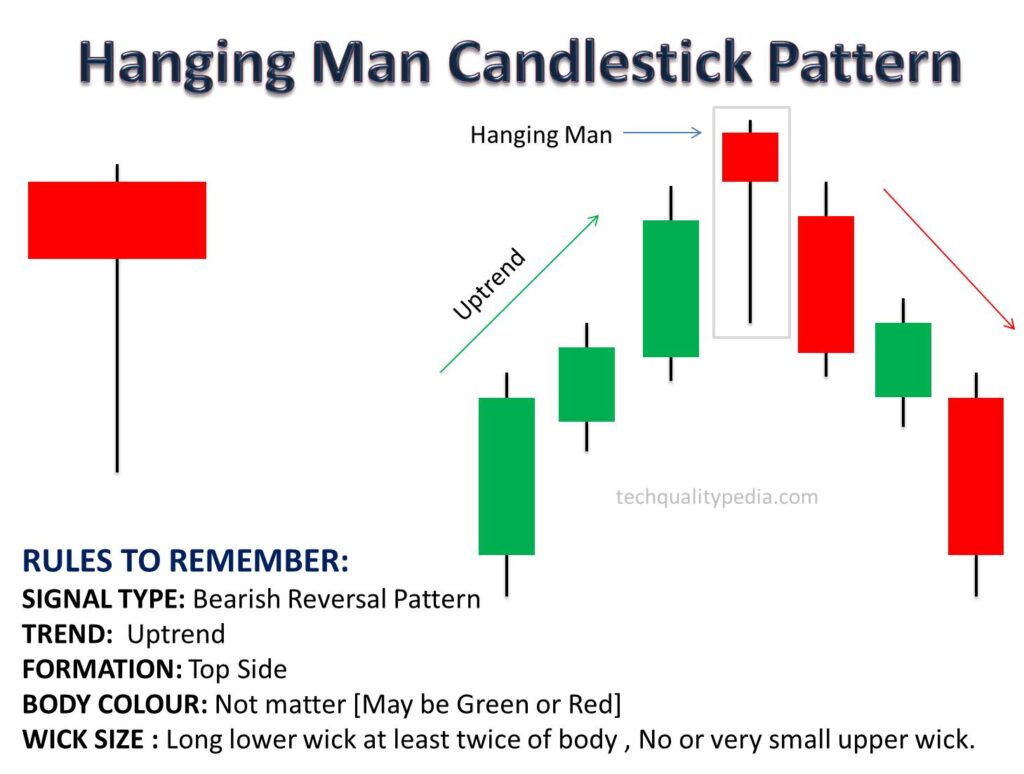
Explanation: The Hanging Man candle appears after an uptrend and indicates a bearish reversal pattern. It suggests that sellers were strong during the session, but buyers managed to move the price back near the opening price. However, a long lower shadow indicates sellers may take control soon and push the price downward.
Candlestick Patterns Gravestone Doji
Image Description: The Gravestone Doji candle patterns have very small or no lower wick and a long upper wick. The open, close, and low prices are nearly the same or very close and appear at the bottom of the candle.
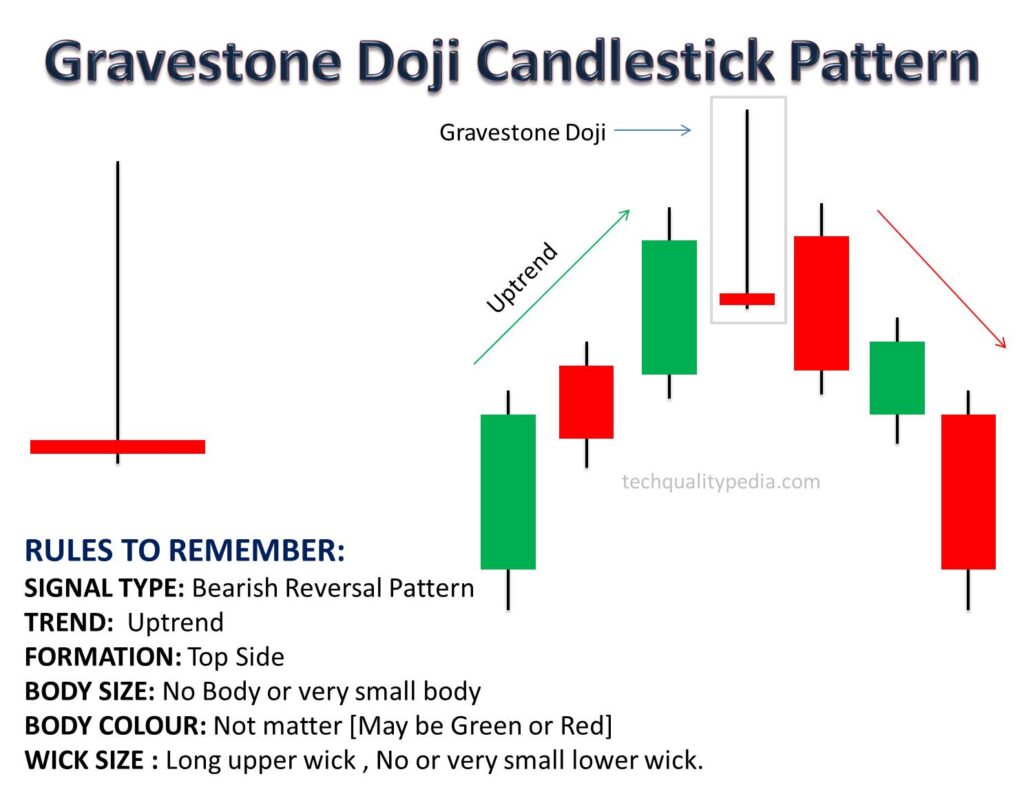
Explanation: The Gravestone Doji appears after an uptrend and signals a bearish reversal. Initially, buyers push the prices upward, but sellers regain control and move the price downward near the opening level.
Candlestick Patterns Bearish Marubozu
Image Description: A Bearish Marubozu Candlestick pattern is formed with a long red body and no upper or lower wicks.
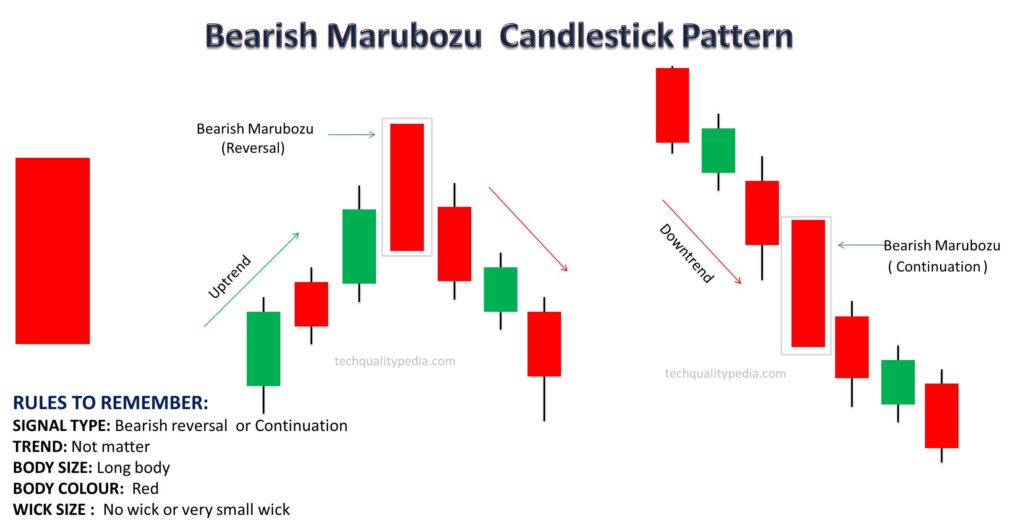
Explanation: A Bearish Marubozu indicates strong selling pressure from start to finish. The sellers were in control and managed to move the price downward during the entire session without any resistance from the buyers.
Bearish Reversal or Continuation: It usually appears after an uptrend and signals the start of a bearish reversal. If it appears during a downtrend, it may signal the continuation of the bearish momentum.
Bearish Engulfing Candlestick
Image Description: Bearish engulfing candlestick pattern form with two candlesticks. The first one is a small candle with a green body, and the second one is a larger candle with a red body that fully engulfs the previous small green candle.
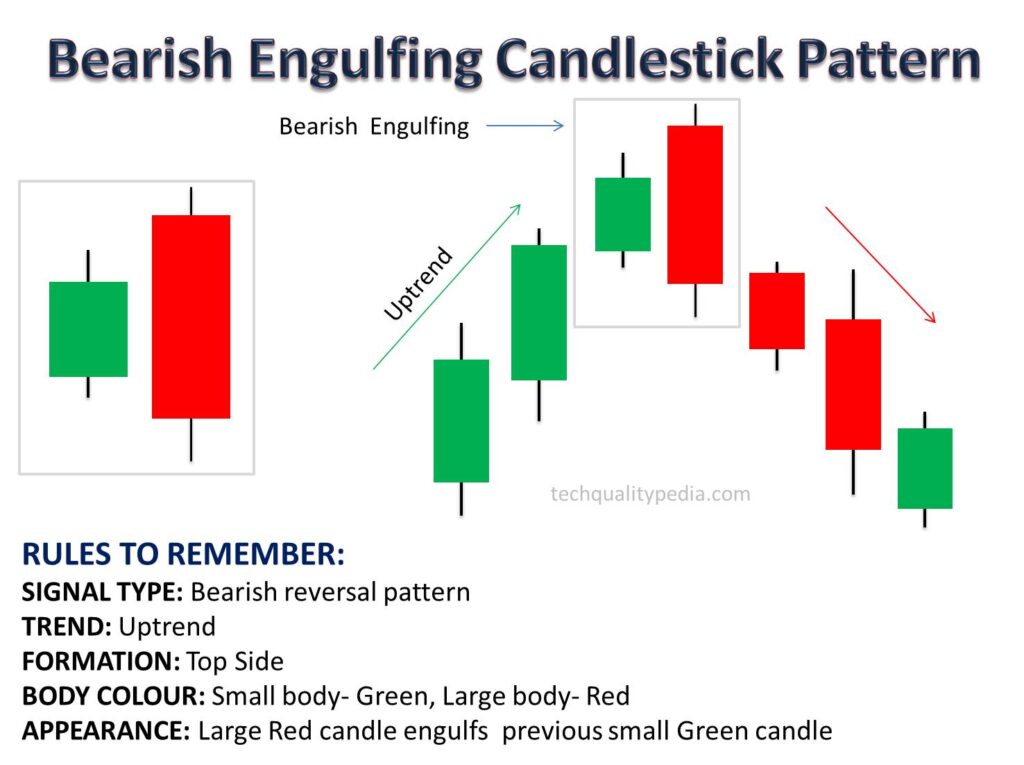
Explanation: This pattern forms when a larger bearish candle (red candlestick) engulfs or covers a previous smaller bearish candle (green candlestick) entirely. Indicating sellers are in control and a bearish reversal trend.
Bearish Harami Candlestick
Image Description: The Bearish Harami also form with two candles. The first is a long green body candle, and the second is a smaller red body candle, which is entirely contained within a long green body candle.
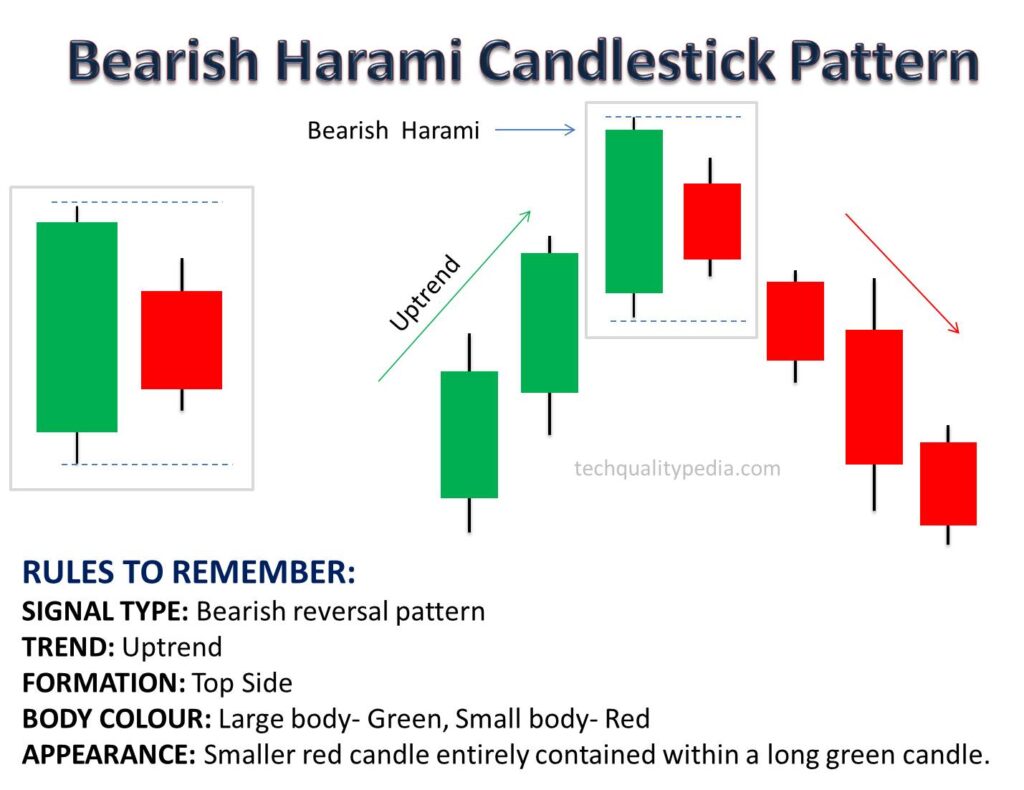
Explanation: The Bearish Harami candlestick appears after an uptrend and indicates a bearish reversal. The large green body candle shows strong buying pressure, but the smaller red body candle inside the long green candle indicates that buyers are losing control, and sellers are starting to take control, which could lead to a price decline.
Candlestick Patterns Evening Star
Image Description: Evening star candlestick patterns form with three candlesticks. The first one is a long candle with a green color body, followed by a small candle (it can be a green or red color body), and the third one is a long candle with a red body.
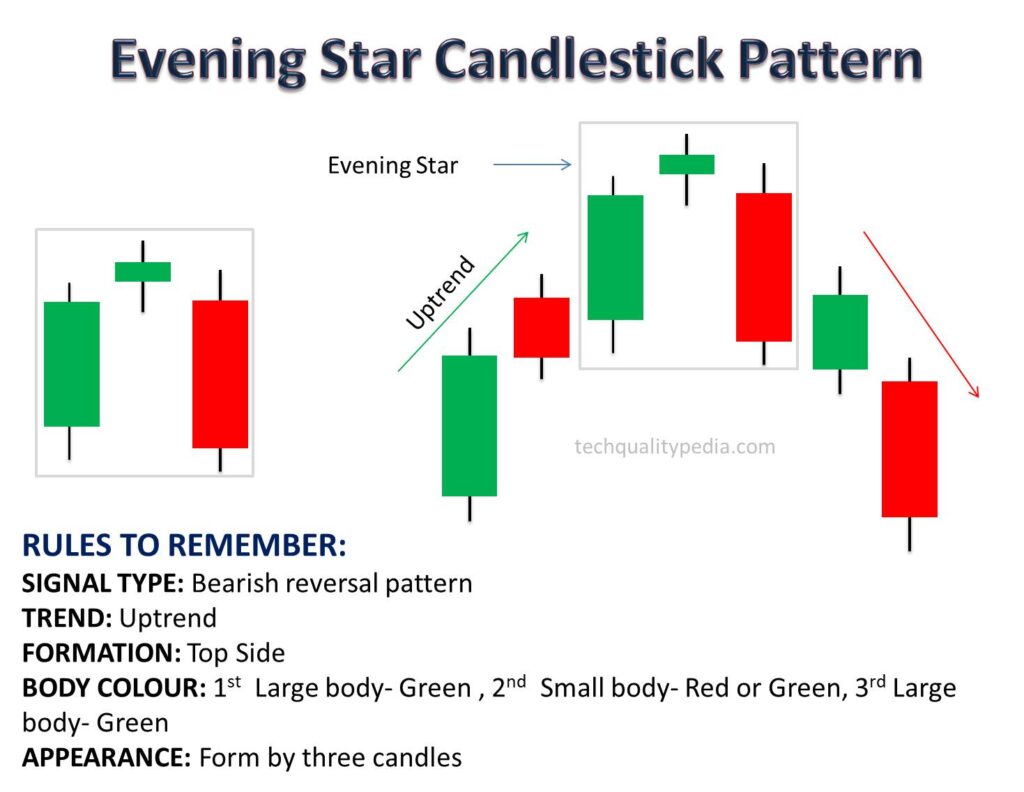
Explanation: Candlestick patterns morning star form a bearish reversal pattern after an uptrend. The small middle candle indicates indecision, and the third red candle confirms the strong bearish reversal.
CANDLESTICK PATTERNS NEUTRAL
There are two types of Neutral Candlestick Patterns formed:
- Doji Candlestick Pattern
- Spinning Top Candlestick Pattern
Candlestick Patterns Doji
Doji Candlestick Meaning
A “Doji” is a Japanese term that means “the same thing”. It indicates uncertainty and indecision in the stock market. When a doji pattern appears, traders use it as a signal to proceed cautiously and await further confirmation on making any buying or selling decisions.
Doji Candlestick Types
There are different types of doji candlestick patterns, including:
- Doji (Bullish or Bearish Reversal)
- Dragonfly Doji (Bullish Reversal)
- Gravestone Doji (Bearish Reversal)
Candlestick Patterns Doji | Doji Star Candle
A Doji candlestick is also known as a Classic Doji or Doji Star candle.
Image Description: Candlestick Doji forms neutral candlestick patterns with very small or no body. The upper and lower wick sizes are generally longer, but it can vary.
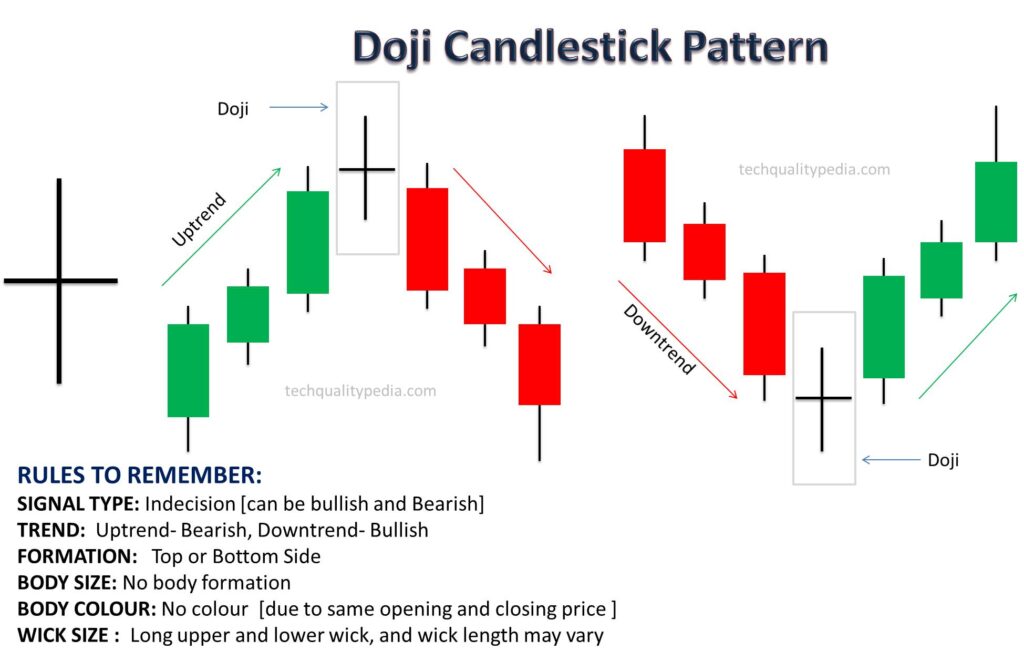
Explanation: A Doji candlestick with no or very small body indicating nearly the same open and close prices, represents uncertainty and indecision in the market. A Doji candlestick pattern may signal a reversal or a continuation of the trend.
Candlestick Patterns Spinning Top
Image Description: A candlestick with a small body with long upper and lower wicks.
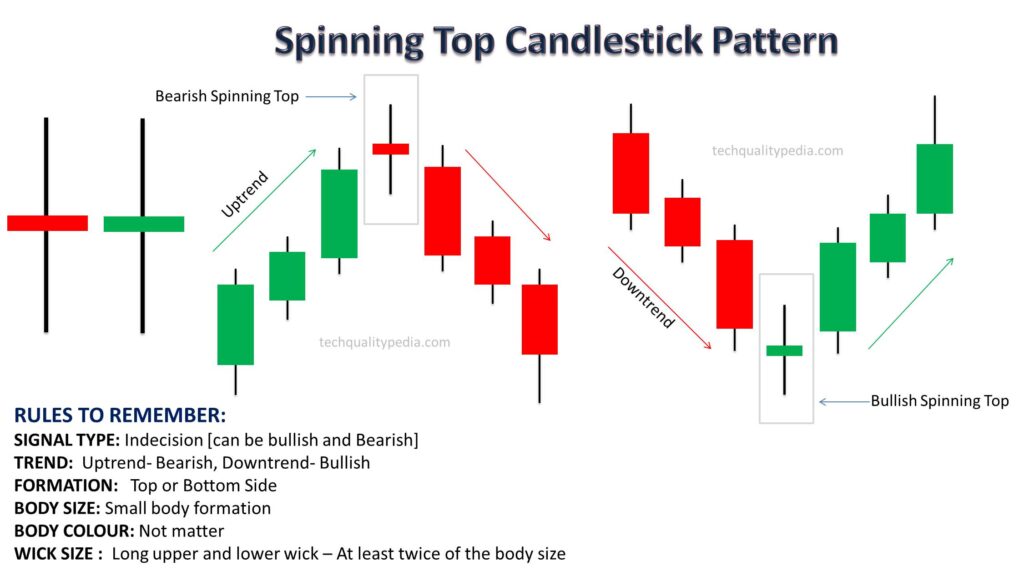
Explanation: A spinning Top candlestick also shows uncertainty and indecision in the market, where neither buyers nor sellers are in control. It may signal trend continuation or reversal.
CONCLUSION
Candlestick patterns provide valuable information about the market price movement and sentiments. Traders or investors can improve their ability to predict and respond to changes in the market by becoming proficient in these patterns. However, it’s important to approach trading and investment with a comprehensive strategy that makes use of risk management and multiple analytical/technical tools such as Indicators and Oscillators (e.g. RSI, Moving Average, MACD, etc.).