The Candlestick Patterns Hammer and Inverted Hammer both are bullish reversal patterns that indicate the end of a downtrend and the beginning of an uptrend. Hammer and Inverted Hammer candlestick patterns show that buyers are gaining strength, which could lead to an upward momentum. Below is a detailed explanation of each bullish hammer candlestick pattern:
Table of Contents
Candlestick Patterns Hammer
There are two types of Hammers patterns formed:
- Hammer Candlestick Pattern
- Inverted Hammer Candlestick Pattern
Hammer Candlestick Patterns
Image Description: A single candlestick with a small body at the top having a long lower wick(shadow) at least twice the body size and no or very small upper wick(shadow). The body color of a hammer candlestick can be either green or red.
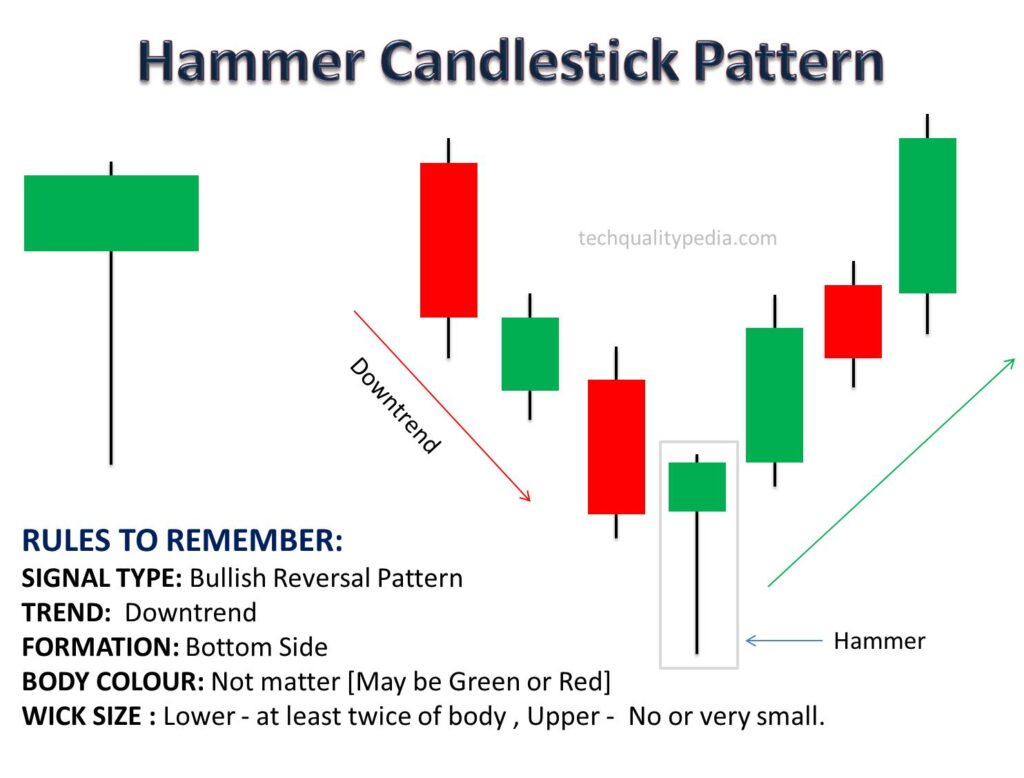
Explanation: The Hammer pattern appears after a downtrend and formed at the bottom side, indicating a bullish reversal pattern. The long lower wick suggests that sellers pushed prices downward but buyers managed to drive them upward, showing more buyer’s control/strength.
Bullish Reversal: The Hammer indicates that despite early selling pressure, buyers are gaining strength and managing to lift the price upward. It signals a possible bullish reversal.
Confirmation: For the pattern to be confirmed, the next candlestick should ideally be bullish (closing higher than the Hammer).
Psychology: The long lower wick shows that the market tested lower prices, but buyers saw the lower prices as an opportunity and moved the price upward, signaling a potential bullish reversal.
Inverted Hammer Candlestick Patterns
Image Description: A single candlestick with a small body at the bottom having a long Upper wick(shadow) at least twice the body size and no or very small Lower wick(shadow). The body color of a hammer candlestick can be either green or red.
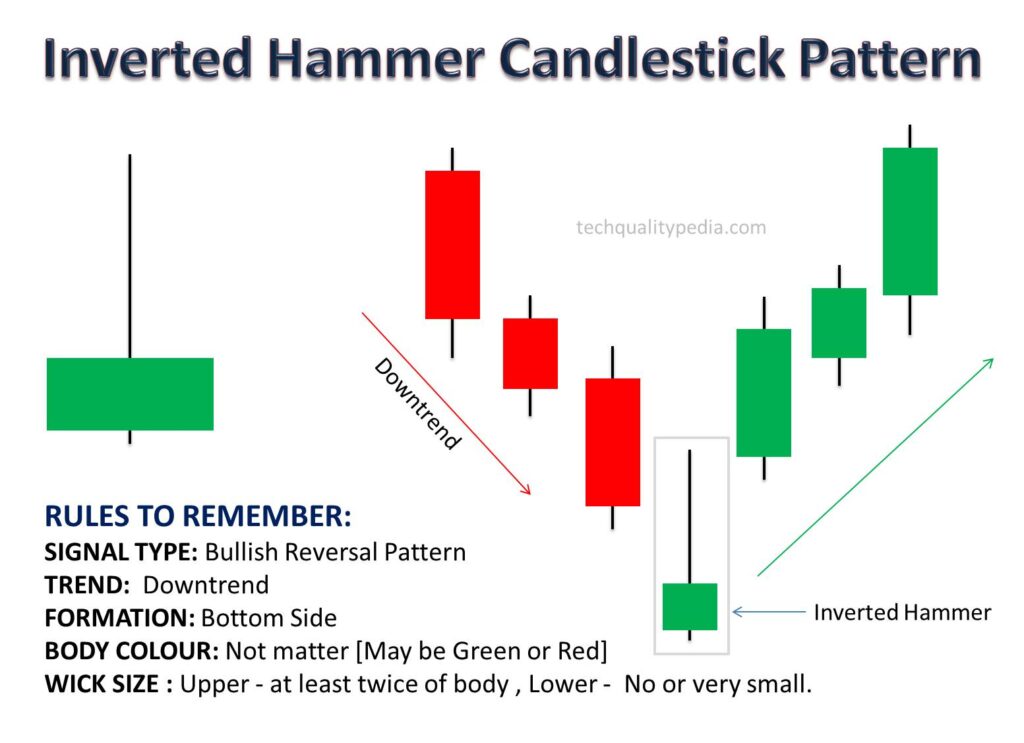 Explanation: The Inverted Hammer pattern appears after a downtrend and indicates a bullish reversal pattern. The long upper wick indicates that buyers are in control and push the price upward during the session, but sellers managed to move the price downward near the opening level. However, a long upper wick suggests buyers may take control soon and lead to bullish momentum.
Bullish Reversal: The Inverted Hammer indicates that while sellers remain in control, the presence of buying pressure signals a possible reversal to the upside.
Confirmation: For confirmation, the next candlestick should be bullish, closing higher than the Inverted Hammer.
Psychology: Although sellers managed to close the price near the opening level, the long upper wick shows that buyers are testing higher prices. This signals a buying strength, especially if the next candlestick forms bullish.
Key Characteristics of Hammer | Inverted Hammer
Location in the Trend: Both the Hammer and Inverted Hammer appear at the bottom of a downtrend and signal bullish reversal patterns. Their importance is higher when found after a prolonged downtrend.
Long Wick: The defining feature of these patterns is the long wick, indicating that the market tested lower (Hammer) prices or higher (Inverted Hammer) prices during the session but finally closed near the opening price level.
Confirmation is Necessary: By itself, neither pattern can be trusted. Confirmation from the next candlestick (ideally a bullish candle) is important before traders act on the signal.
Volume: If the Hammer or Inverted Hammer candlestick forms with high volume, it increases the reliability of the signal, suggesting that there is strong buying pressure in the market.
Conclusion
The Hammer signals a potential bullish reversal at the bottom of a downtrend, with buyers stepping in after a period of strong selling pressure.
The Inverted Hammer also suggests a bullish reversal, showing that buyers are testing higher prices even though sellers still maintain some control.
The Hammer and Inverted Hammer both patterns are key indicators of potential bullish reversals, but they must always be confirmed by the following candlestick or additional technical indicators and oscillators (e.g. RSI, Moving Average, MACD, etc.) before traders make decisions.