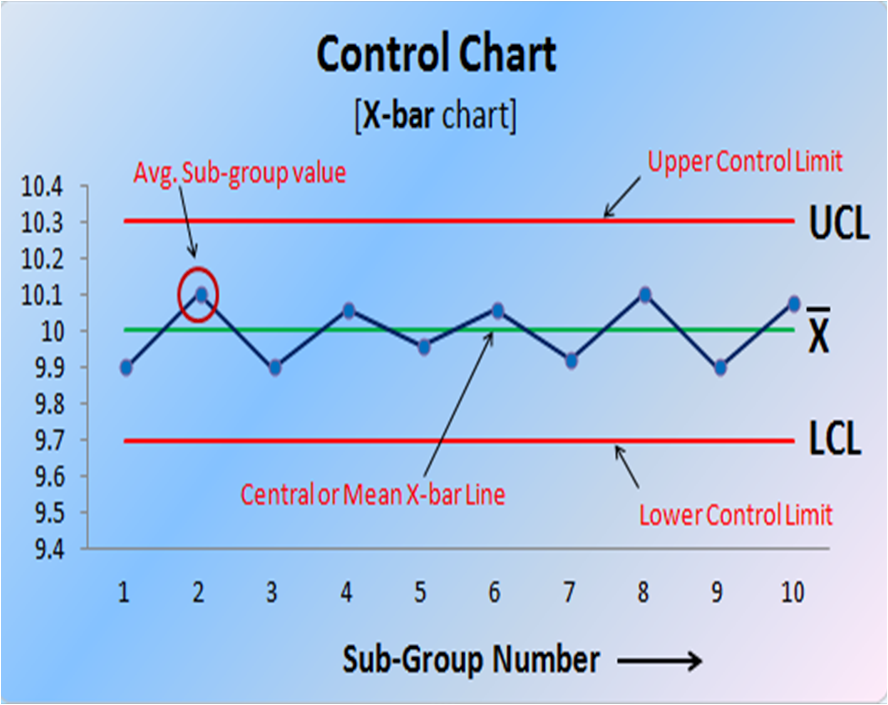
Control chart is also known as SPC chart or Shewhart chart.
It is a graphical representation of the collected information/data.
And helps to monitor the process centering or process behavior against the specified/set control limits.
Control chart is a very powerful tool to find/investigate the source of Process Variations present in the manufacturing processes.
Tells when to take necessary action to eliminate the Common or Random or Chance variations and Special cause of variations.
With the help of Control chart, Process Capability of the production process is measured by Cp and Cpk and Pp and Ppk study.
This is very important basic 7 QC Tools and extensively used in SPC and Problem Solving Techniques such as 8D, PDCA and Six Sigma.
Table of Contents
History of Control Chart
Dr. Walter A. Shewhart, an American, has been credited with the invention of control charts for variable and attribute data in the 1920s, at the Bell Telephone Industries.
Types of Control Chart
There are two types of control Charts :
1- Variables (Continues Value)
- X -R chart (Average value and range)
- X (MR) chart (measured value)
2- Attributes (Discrete Value)
- pn chart (Number of defective value)
- p chart (Fraction Defectives)
- c chart (Number of Defects)
- u chart (Number of defects per unit)
Elements of Typical Control Charts
- Horizontal axis for sample number or sub-group value.
- Vertical axis for sample statistics e.g. Target or Avg. mean line, UCL and LCL Line.
- Target or Avg. Mean or Central Line – X bar
- Upper control Limit line-UCL Line
- Lower control Limit line-LCL Liner
- Plotting of the sample sub-group avg. value.

When to use a Control chart ?
- Visual display for Process output.
- To identify variation at its source.
- To monitor, control & improve process performance.
Benefits of Control charts
- To predict process visually.
- Helps to identify Common and Special cause of variations.
- Provides indication for taking action.
Steps for making Control Chart
- Fulfill precondition
- Complete preparatory steps
- Data/Information collection
- Making Trial Control limits
- Validation of trial control limits.
- Process Capability study i.e Cp and Cpk study
- Ongoing process control
- Continual improvement
Calculation of Trial Control Limits
- Trial Control limits for Average Chart:
UCLx = X double bar + A2*R bar
LCLx = X double bar – A2*R bar
- Trial Control limits for Range Chart:
UCLR = D4 * R bar
LCLR = D3 * R bar
Where D4, D3 and A2 are constant varying as per sample sub-group size.
