The process capability indices (Cp and Cpk) are also called process capability index and are used for process capability analysis.
Process capability analysis is carried out to measure the ability of a process to meet the specifications.
AHistogramandControl Chartsare the basic 7 QC Toolsthat are used in process capability analysis.
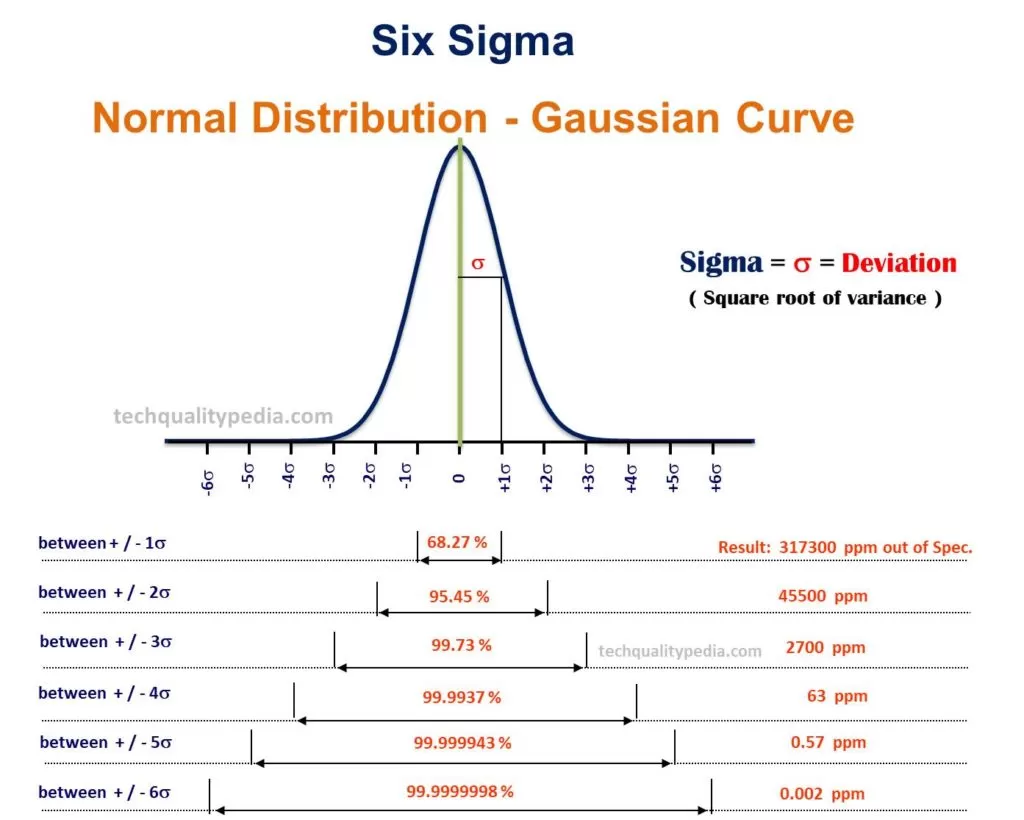
Six Sigma Methodology is used to improve process capability by process variation reduction.

Table of Contents
Process Capability Index | Cp and Cpk
Process Capability
Process capability – Cp: This is defined as the tolerance width divided by the total spread of the process (6 Sigma).
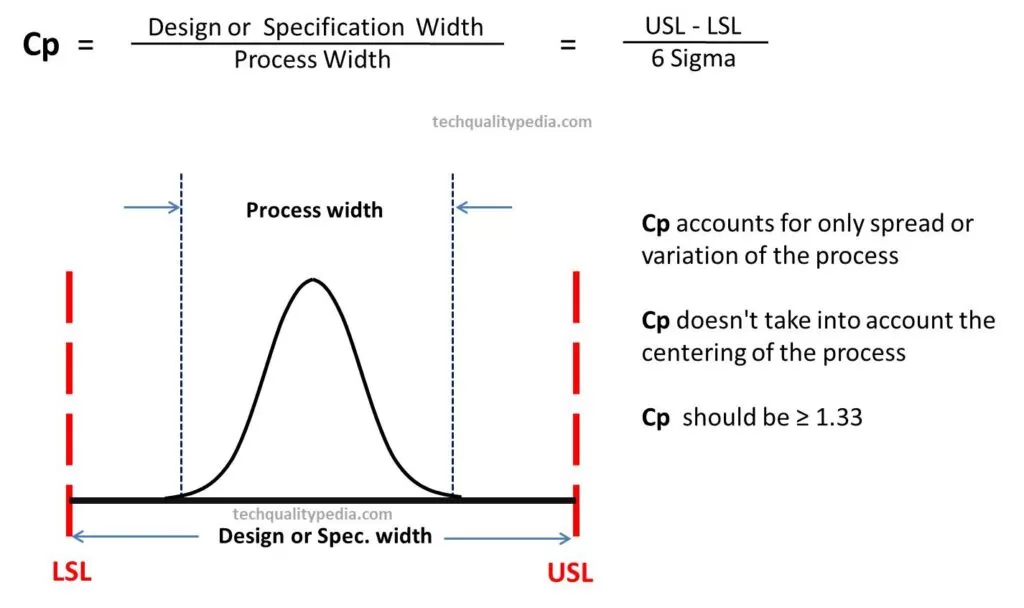
Cp indicates the spread of variation present in a process.
Cp should not looked into isolation, it is only used to find out whether the process is capable or not i.e. Cp ≥1.33

Process Capability Index – Cpk: This is the capability index that accounts for the centering of the process and is defined as the minimum of Cpk upper and Cpk lower.
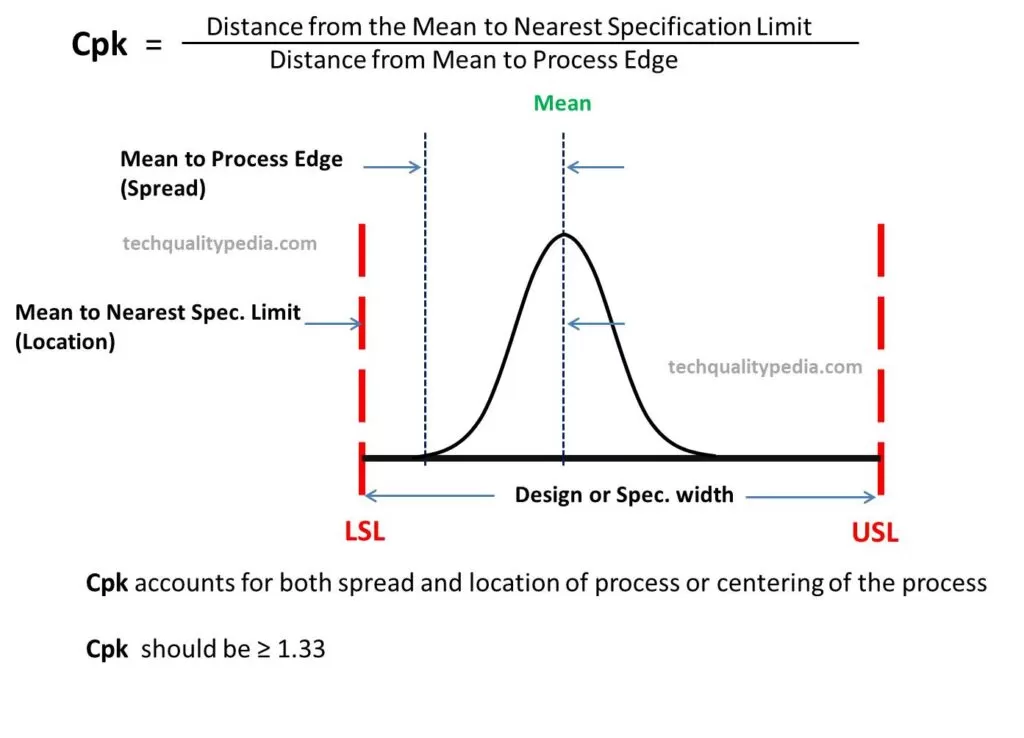
Cpk is a measure of process performance capability.
Cpk indicates the shifting or closeness of the process average from the target or mean value.
Cpk should always be looked into, it is used to find out whether the process is capable of meeting the customer’s requirements or not i.e. Cpk ≥1.33
Cpk Process Capability Index


Interpretations of Cp and Cpk
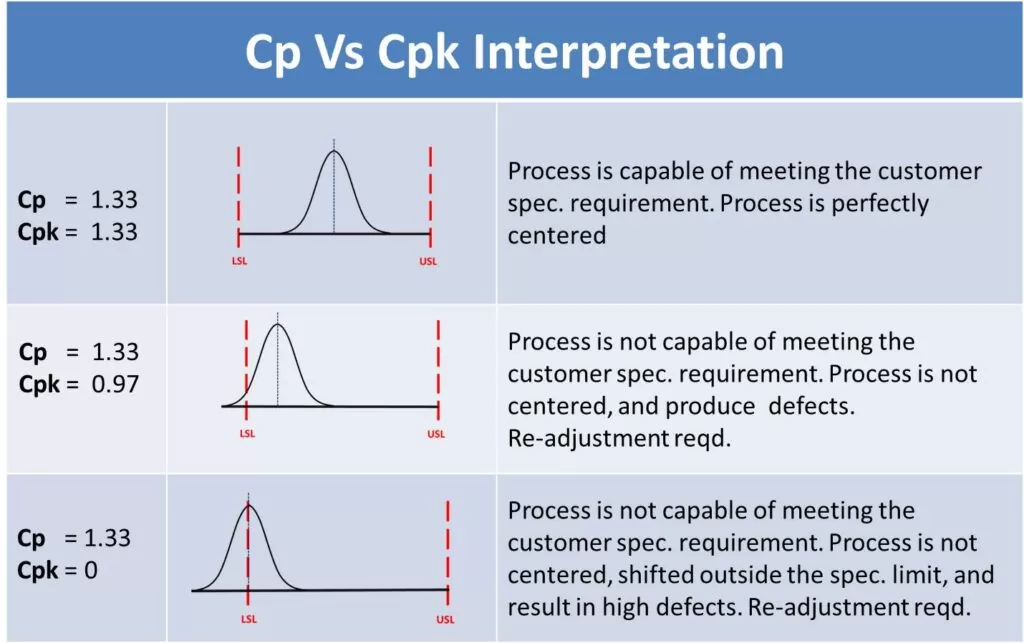
When the Cp value is greater than 1 i.e. Cp value >1: The process spread is less and all products fall within the specification limit. Here the process is said to be quite capable of meeting the specification limit.
When the Cp value is equal to 1 i.e. Cp value =1: The process spread is a little wide but running within the designed specification limit. Here the process is said to be just capable of meeting the specification limit.
When the Cp value is less than 1 i.e. Cp value <1: The process spread is large and most of the products fall outside the specification limit. Here the process is said to be incapable.
When the Cp value is equal to Cpk i.e. Cp=Cpk: The Process means is said to be at centre.
When the Cpk value is less than 1 i.e. Cpk value <1: Indicates that the mean of the process is shifted from the target and defects will be produced.
When the Cpk value is greater than 1 i.e. Cpk value >1: The center or mean of the process may be shifted from the target but still the process is capable of meeting design specifications.
To achieve Six Sigma quality in the organization, we must reduce the variation in the process to achieve the desired value of Cp.
Interpretations of Process Capability Histograms
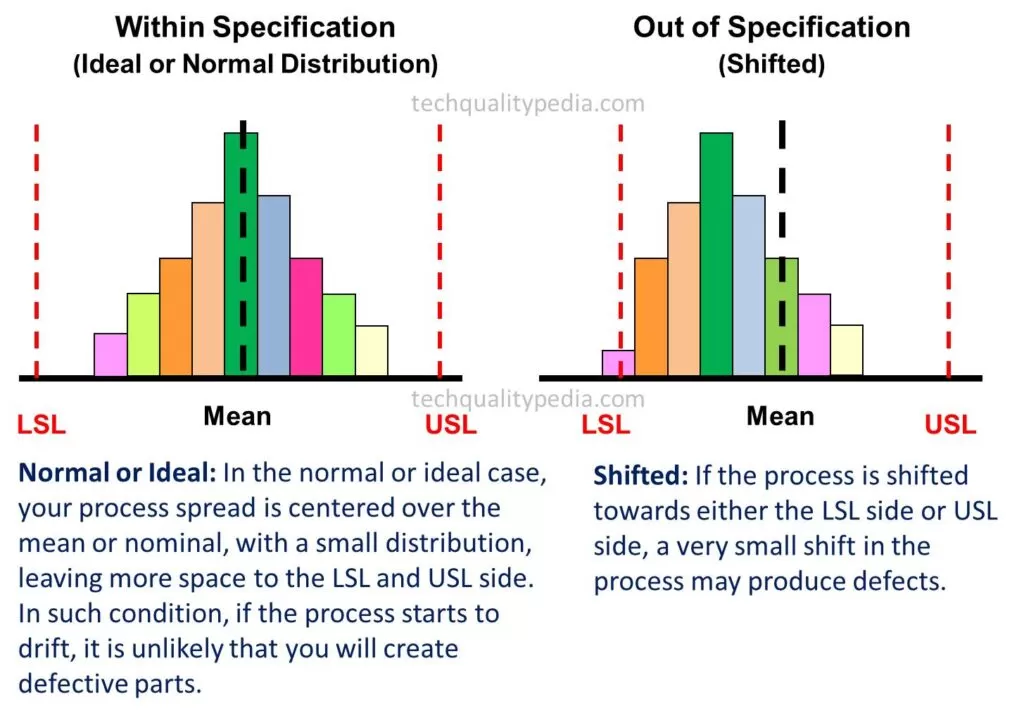
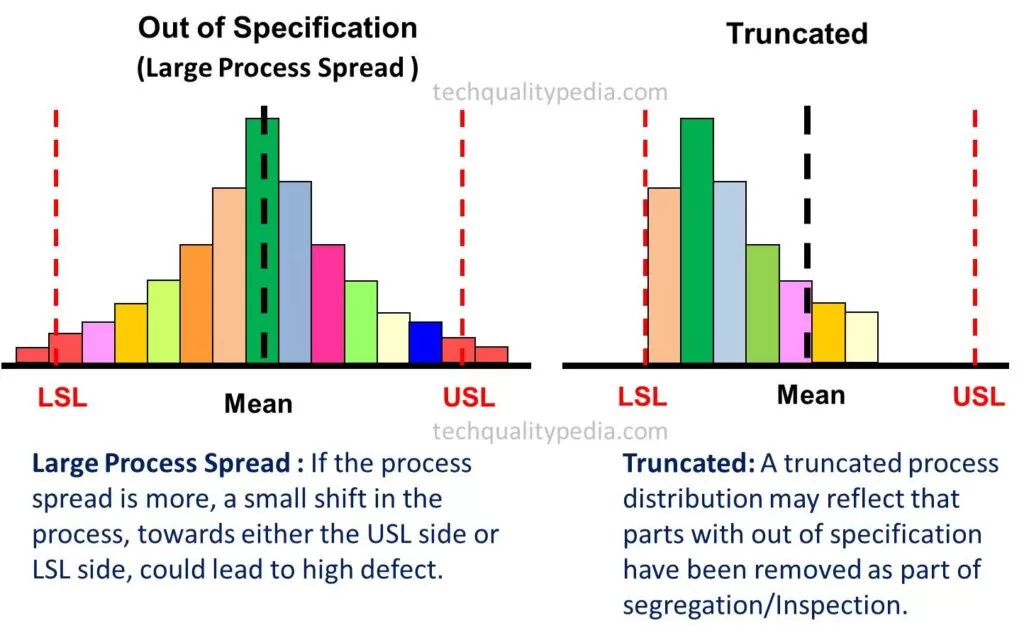
The histograms show various frequency distributions or process spreads in the manufacturing process, and some common cases are described here along with the graph:
Normal or Ideal:In the normal or ideal case, your process spread is centered over the mean or nominal, with a small distribution, leaving more space to the LSL and USL side. In such conditions, if the process starts to drift, it is unlikely that you will create defective parts.
Shifted:If the process is shifted towards either the LSL or USL sides, a very small shift may produce defects.
Large Process Spread: If the process spread is more, a small shift in the process, towards either the USL side or LSL side, could lead to high defects.
Truncated:A truncated process distribution may reflect that parts with out of specification have been removed from the data set as part of segregation/inspection.
Cp and Cpk Difference
| Process Capability Cp | Process Capability Index Cpk | |
| Process Mean and Variability | Assumes the process mean is centered within the specification limits. It measures potential capability but does not reflect actual performance if the process mean is off-center. | Accounts for shifts in the process mean and provides a more realistic assessment of process capability, considering the actual position of the process mean within the specification limits. |
| When to Use | Best used for evaluating the potential capability of a process under ideal conditions, where the process mean is perfectly centered. | Provides a practical view of process performance, considering real-world variations and shifts. It is used to assess how well the process performs in its actual state. |
| Identifying Issues | If Cp is low, it indicates that the process may not have the potential to meet specifications, assuming perfect centering. | A low Cpk value indicates actual performance issues, including process mean shifts or variability. |
| Implementing Improvements | Focuses on reducing variability and ensuring the process is centered within specification limits. | Address both centering issues and overall variability to improve process performance. |
| Implications for Quality Control | A high Cp value indicates that the process has the potential to meet specifications if centered properly. However, it does not guarantee that the process will consistently meet specifications if the mean is not centered. | A high Cpk value reflects actual process performance and centering. A lower Cpk value compared to Cp may suggest that the process mean is not centered or that there are significant variations affecting process performance. |
Cp Value | Normal Production Run | New Product Development Stage
Cp value should be ≥ 1.33 during the normal production process.
The recommended value of Process Performance Capability-Pp is ≥ 1.67 during the new product development (NPD) stage.
When to Use Cp and Pp
Pp is used when evaluating the real-world performance of a process, accounting for actual variations and shifts. It is a measure of performance considering all sources of variation. Whereas Cp is used when assessing the potential of a process that is expected to be stable and centered. It is a measure of capability under ideal conditions.
Cp and Cpk Process Capability Analysis

Conclusion
Cp and Cpk are crucial metrics in process capability analysis, each of which provides distinct perspectives on process performance. Cp measures potential capability under ideal conditions, while Cpk offers a practical assessment by accounting for shifts and variability. By understanding and using these metrics effectively, you can improve process quality and performance.
FAQs
Q1. What is the significance of Cp in process capability?
Cp measures a process’s potential to meet specification limits if it is perfectly centered. It indicates how capable a process can be under ideal conditions.
Q2. How does Cpk differ from Cp in practical application?
Cpk accounts for shifts in the process mean and provides a realistic view of process performance, considering actual variability and centering.
Q3. Why might Cp and Cpk values differ for the same process?
Cp and Cpk can differ if the process mean is not centered or if variations are affecting the process. Cp assumes ideal conditions, while Cpk represents real-world performance.
Q4. How can I improve both Cp and Cpk values?
To improve Cp, ensure the process is centered and reduce variability. To improve Cpk, address both centering issues and overall process variability.
Q5. How often should Cp and Cpk be measured?
Cp and Cpk should be measured regularly, especially after changes in the process or equipment, to monitor performance and ensure ongoing quality control.
Q6. How does Pp differ from Cp in practical application?
Pp reflects actual process performance, including all sources of variability and shifts, providing a more realistic assessment than Cp.
You may also like:

