“Fishbone Diagram” also known as “Ishikawa diagram” and “Cause and Effect diagram.
It helps to identify all potential or probable causes for further validation to find the actual root cause of the problem and necessary actions.
The potential cause identification carried out using tools or techniques like brainstorming and fishbone diagram.
In a brainstorming session, all 4M or 6M factors are taken into consideration to identify the potential causes.
4M or 6M factors are – Man, Machine, Method, Material, Measurement, and Mother nature (also called Environment).
This is a very important basic 7 QC Tools and extensively used in Problem Solving Techniques like 8D, PDCA, and Six Sigma.
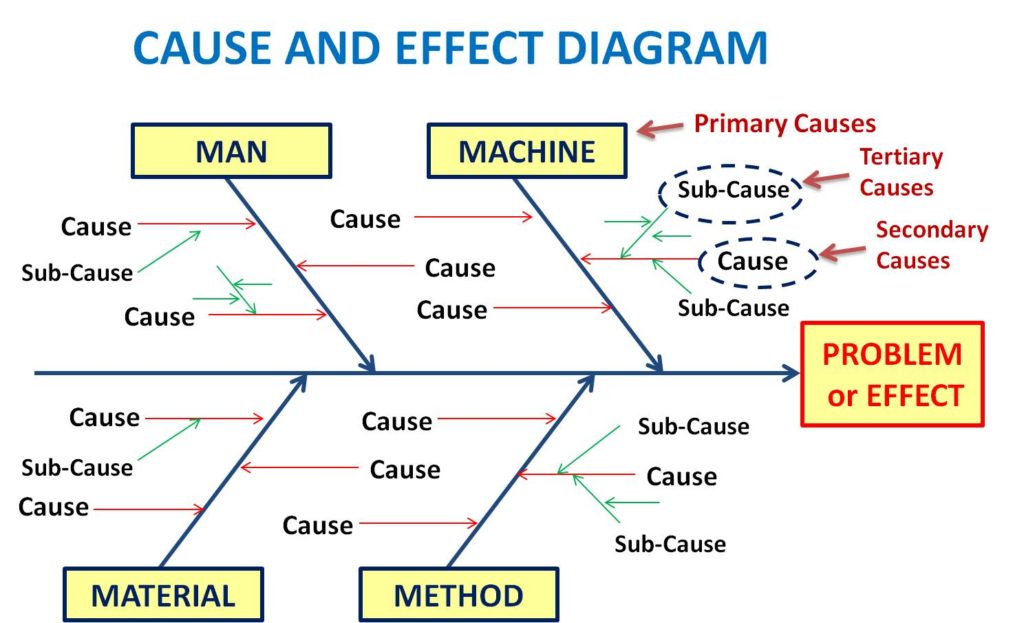
Table of Contents
About Fishbone Diagram
- Developed by Kaoru Ishikawa of Japan.
- To find out probable or potential that contributes to problem/effect.
- The brainstorming technique is used to identify potential causes.
- 4M or 6M factors analysis done in brainstorming.
- Helps to identify the root cause of the problem.
When to use an Ishikawa Diagram?
- Problem-solving to focus on the Quality problem.
- To sort out interactions among factors for a cause.
- To analyze existing problems.
- For preparing Corrective and Preventive Actions (CAPA) against internal or external customer complaints.
- For submission of corrective actions against ISO/IATF external audits.
- Use along with quality tools like 5 Whys, Pareto Analysis, and Check sheets etc.
Why use the Ishikawa Diagram?
- Helps to determine the Root Cause of a Problem.
- To identify the Key Inputs variables – Primary, Secondary, and Tertiary causes.
- Helps in identifying the possible cause for variation present in a process.
- Increases knowledge of a process and its factors.
- Helps to identify areas for data collection.
Steps for making “Cause and Effect Diagram”
Step-1: Identify & define the problem/effect. Use the 5W2H approach to define the problem.
- Decide on the effect to examine.
Step-2: Fill in the Problem Box & draw the spline.

Step-3: Identify main 4M or 6M categories/factors i.e. Primary causes.
Draw major cause categories and connect them to the “backbone” of the fishbone diagram.

Step-4: Identify Probable Causes that contribute to the problem/effects. Also called Secondary causes.
Use the Brainstorming technique and check sheet for cause analysis.
- Brainstorming – on 4M factors without previous preparation
- Check sheet – collected/recorded data for analysis

Step-5: Add detailed levels i.e. identify sub-causes & analyze the diagram. Also called Tertiary causes.

Benefits of “Fishbone Diagram“
- Focus is on ‘Causes’ rather than on ‘Symptoms’ or ‘assumptions’.
- Break problems down into small pieces to find the real root cause.
- Identifies hidden causes: Looks beyond obvious assumptions or symptoms.
- Increase people involvement & teamwork.
- Improves team performance & effectiveness.
- Improves process knowledge.
- A common understanding of factors causing the problem.
- Easy to understand due to visual clarity and best for presentations.